
Figure 1. Flow cytometric analysis of VEGF-containing eye cells in the choroid and the retina.
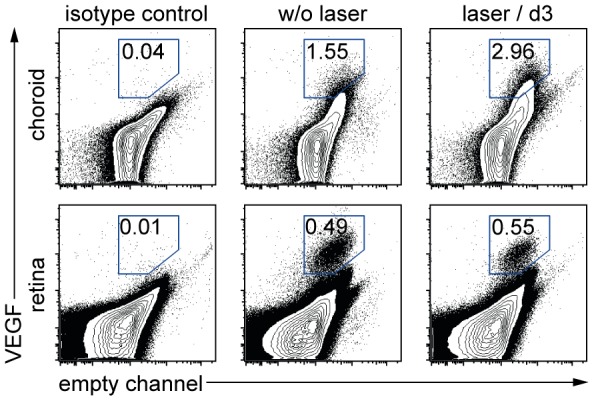
VEGF-containing eye cells from the choroid and the retina of untreated (middle) and laser-treated (right) mice are shown. Specificity was verified by an isotype control (left). Cells positive for VEGF were plotted versus an empty fluorescence channel. Percentages are means of the respective group. Dot-plots display representative data from one of two independent experiments. A total of 4–5 mice were used per group in each of these experiments