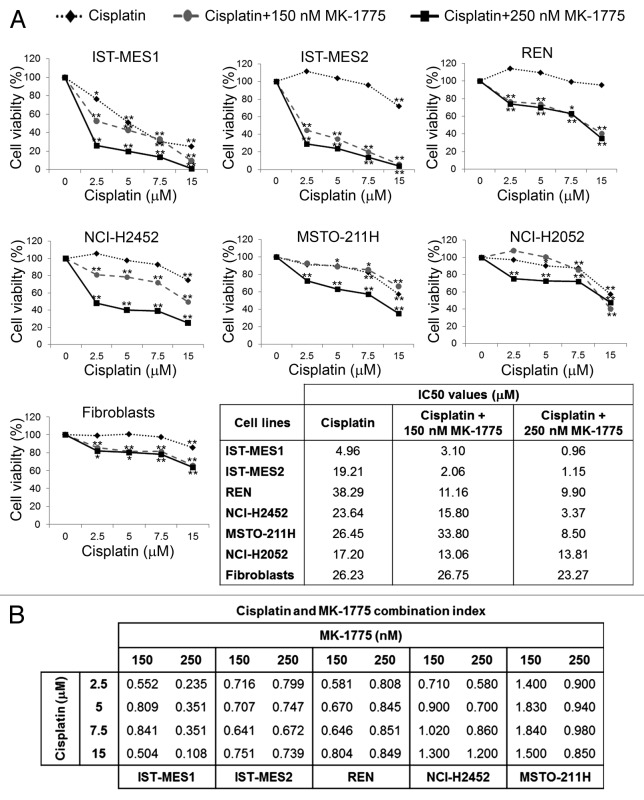
Figure 1. Effect of co-treatments with cisplatin and MK-1775 on cell viability of MM cells and fibroblasts. (A) MTS analysis of cell viability. Results are reported as means of three experiments and expressed as percentages of cell viability calculated with respect to control cells treated with DMSO alone. The absorbance values of treated and control samples were subjected to one-way Anova with Dunnett post-test. Statistically significant differences between treated and control cells are indicated with *significant (P < 0.05) or **very significant (P < 0.01). In the table are reported the half maximal inhibitory concentration (IC50) values of cisplatin alone and cisplatin in combination with 150 nM or 250 nM MK-1775 on MM cell lines and fibroblasts. (B) Combination index (CI) values for cisplatin and MK-1775 in MM cell lines. CI = 1 indicates additivity, CI > 1 indicates antagonism, and CI < 1 indicates synergy.

An official website of the United States government
Here's how you know
Official websites use .gov
A
.gov website belongs to an official
government organization in the United States.
Secure .gov websites use HTTPS
A lock (
) or https:// means you've safely
connected to the .gov website. Share sensitive
information only on official, secure websites.
