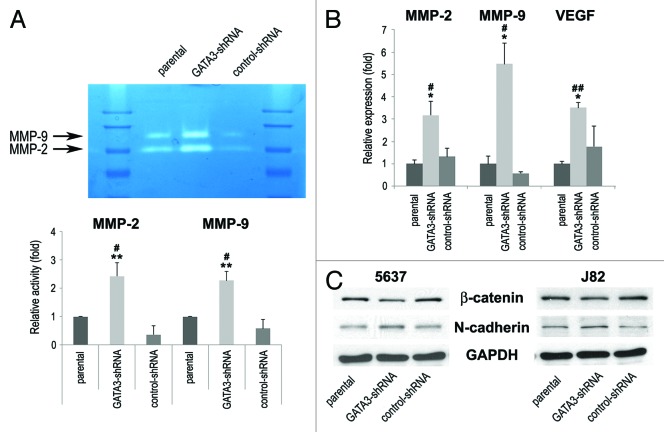
Figure 4. The expression of cell migration/invasion-related molecules in bladder cancer cells. (A) J82-parental/GATA3-shRNA/control-shRNA lines were subjected to gelatin zymography. The activities of MMP-2 (72 kDa) and MMP-9 (92 kDa) were indicated by clear zones of gelatin lysis against a blue background of stained substrate. Relative densitometry values (mean + standard deviation; those in parental cells set as one-fold) for the activities normalized by cell numbers from at least three independent experiments are indicated in the lower panel. #P < 0.05 (vs. parental). **P < 0.01 (vs. control-shRNA). (B) RNA extraction and subsequent real-time RT-PCR for MMP-2, MMP-9, and VEGF were performed in TCC-SUP-parental/GATA3-shRNA/control-shRNA. Expression of each specific gene was normalized to that of GAPDH. Transcription amount is presented relative to that of parental cells (set as one-fold). Each value represents the mean + standard deviation from at least three independent experiments. #P < 0.05 (vs. parental). ##P < 0.01 (vs. parental). *P < 0.05 (vs. control-shRNA). (C) 5637-parental/GATA3-shRNA/control-shRNA and J82-parental/GATA3-shRNA/control-shRNA lines were analyzed on western blotting, using an antibody to β-catenin (92 kDa) or N-cadherin (130 kDa). GAPDH (37 kDa) served as an internal control.

An official website of the United States government
Here's how you know
Official websites use .gov
A
.gov website belongs to an official
government organization in the United States.
Secure .gov websites use HTTPS
A lock (
) or https:// means you've safely
connected to the .gov website. Share sensitive
information only on official, secure websites.
