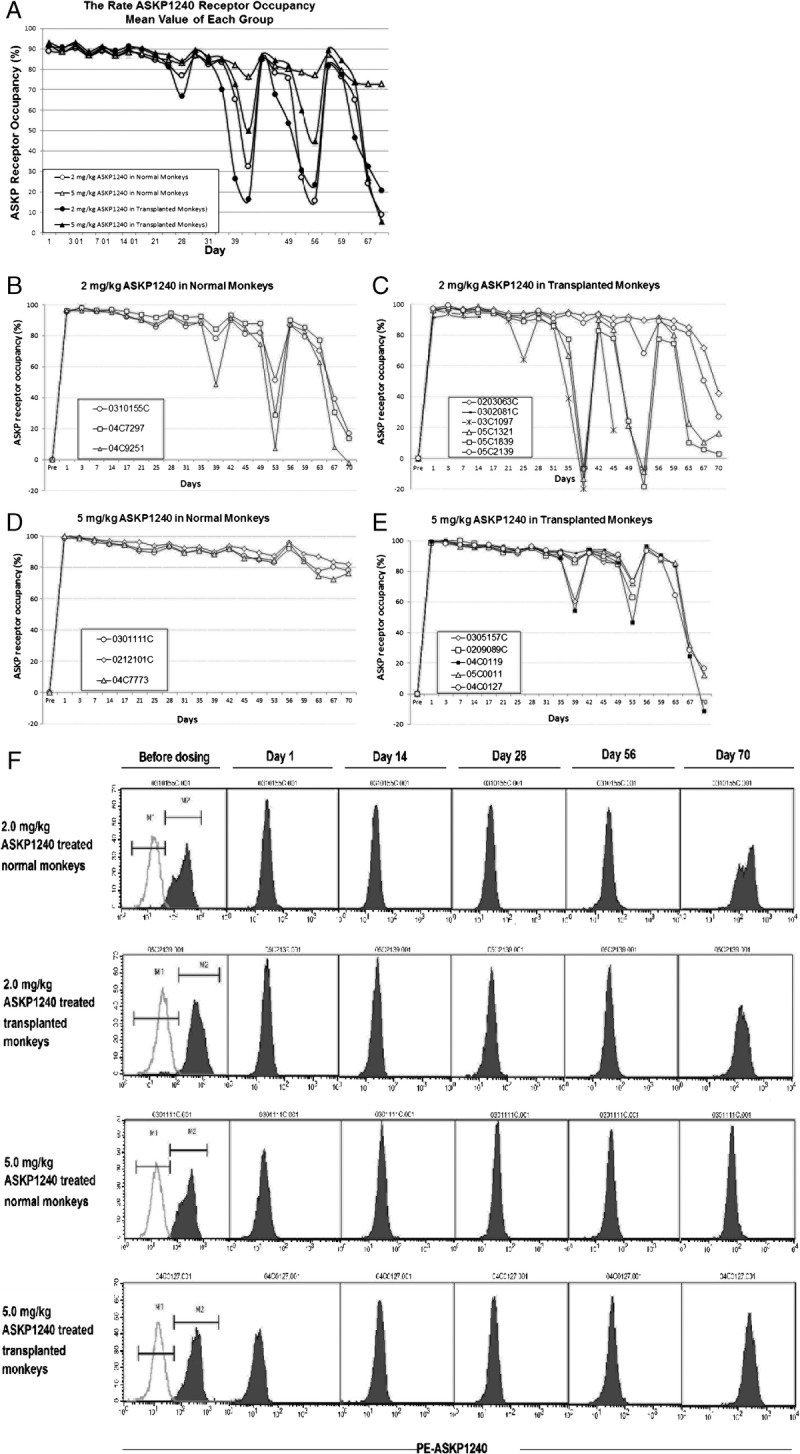
FIGURE 2.

PD study. Rate of ASKP1240 receptor occupancy in the low- and high-dose ASKP1240-treated normal and transplanted monkeys (A). Rate of ASKP1240 receptor occupancy in the 2.0 mg/kg ASKP1240-treated normal monkey group (B), 5.0 mg/kg ASKP1240-treated normal monkey group (C), 2.0 mg/kg ASKP1240-treated transplanted monkey group (D), and 5.0 mg/kg ASKP1240-treated transplanted monkey group (E). The representative MFI data show the ASKP1240 occupancy in the four different groups; the green line represents the controls (F).
