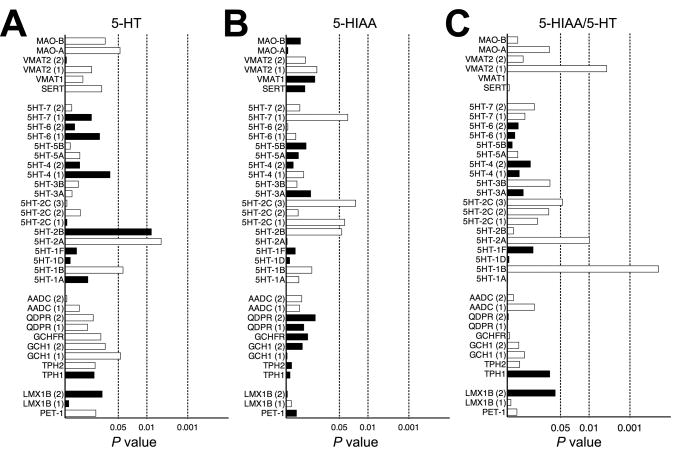
Figure 5.
Gene expression correlations of genes that have known roles in 5-HT homeostasis and signaling with midbrain 5-HT traits: (A) 5-HT levels, (B) 5-HIAA levels and (C) 5-HIAA/5-HT ratios. Dashed lines represent significance levels of 0.05, 0.01 and 0.001 (Spearman's rank test). Open bars represent positive correlations and filled bars denote negative correlations. Genes with multiple probes, designated by parentheses, are plotted separately.

