
Figure 3. Overall digestion survival (ODS %) index (A), hydrophobicity (H %) index (B), and autoaggregation (AA %) index (C) of the 17 selected strains.
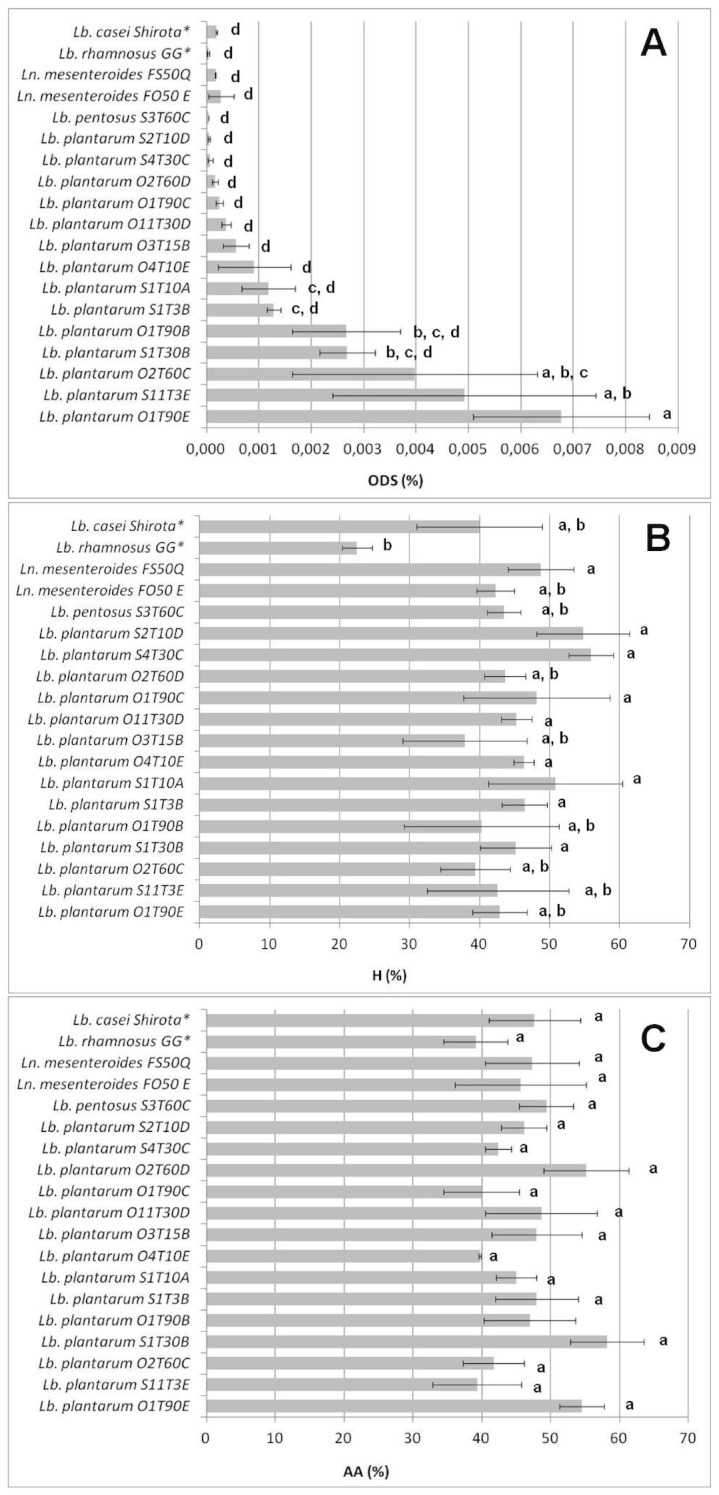
The data are the means of three independent experiments ± SEM and the bars marked with different letters (a,b,c,d) indicate a significant difference at P<0.05 (ANOVA with Duncan’s test as post hoc). (*): reference strains for the experiment.