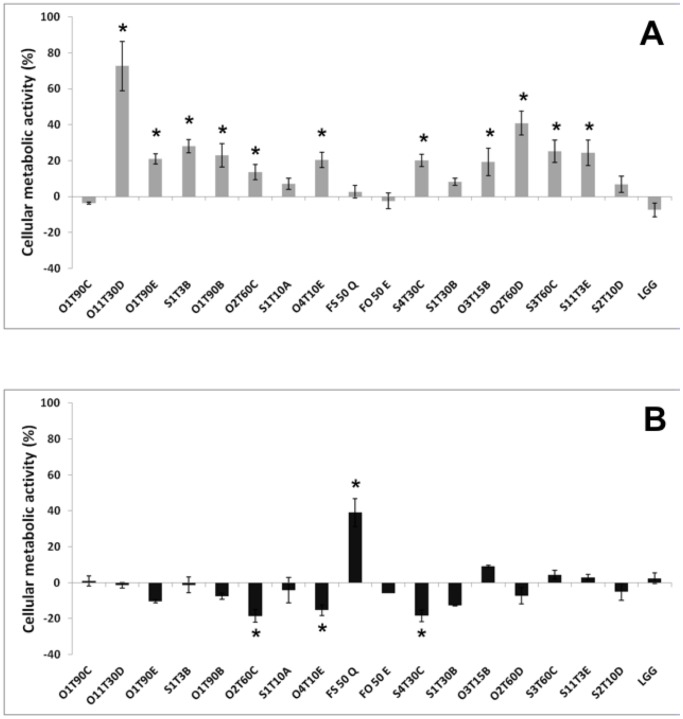
Figure 4. Variation of the cellular metabolic activity in H4-1 (A) and TLT (B) cells, respectively incubated with heat inactivated and live bacteria for 24 h.
Undifferentiated model was used for the H4-1, whereas a complete 3D model (H4-1/TLT) was developed to assess the cellular metabolic activity in TLT. The data are expressed as mean ratios (% -100; ±SEM) of absorbance in the treated well (OD of test sample) and those not treated (OD of blank) with bacteria: 100- (OD of test sample/OD of blank×100). The asterisks (*) highlight significantly different values (Duncan’s test; P<0.05) compared to the reference strain Lb. rhamnosus GG (LGG).

