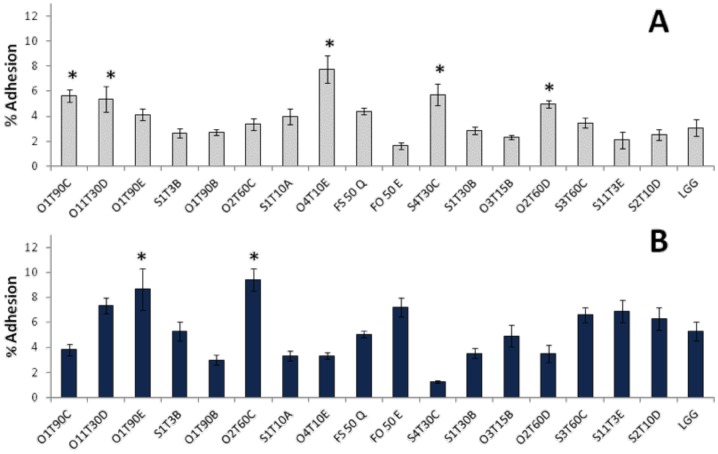
Figure 5. Adhesion profile of the LAB to the undifferentiated monolayer (A) and 3D functional model of H4-1 (B), expressed as the mean ratio (%) between the bacteria recovered from the human cells after incubation and the washing steps and the initial bacterial count (8.0±0.5log10 CFU mL−1) of the inoculum (n = 3; ± SEM).
The marked bars (*) indicate significantly (P<0.05) higher values (ANOVA with Duncan’s test as post hoc) to the reference strain Lb. rhamnosus GG (LGG).

