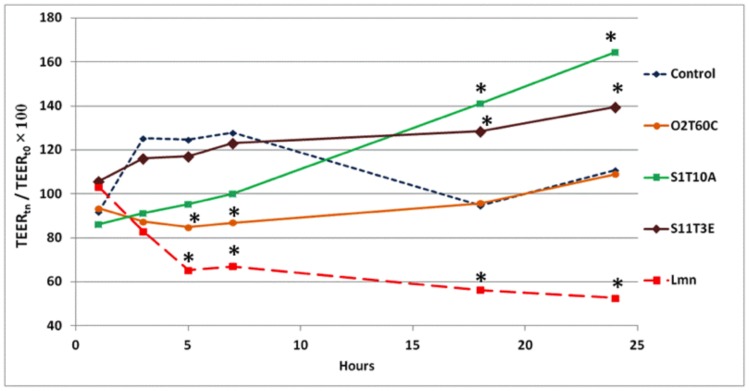
Figure 7. Time dependent TEER of the polarized H4 monolayer exposed to the strains: O2T60C, S1T10A, S11T3E and L. monocytogenes WT (Lmn).
The untreated monolayer was used as a reference control. The bacterial effect on TEER dynamics was tested with 107 CFU mL−1 of bacterial inoculum. The data of three independent experiments are expressed as the ratio (%) of TEER at time n in relation to the initial value (t0). The marked bars (*) indicate significantly different values (P<0.05) from the untreated control (ANOVA with Duncan’s test as post hoc). The complete dataset of the experiment (mean ± SEM), with the results of the statistical analysis, is reported in Table S2.

