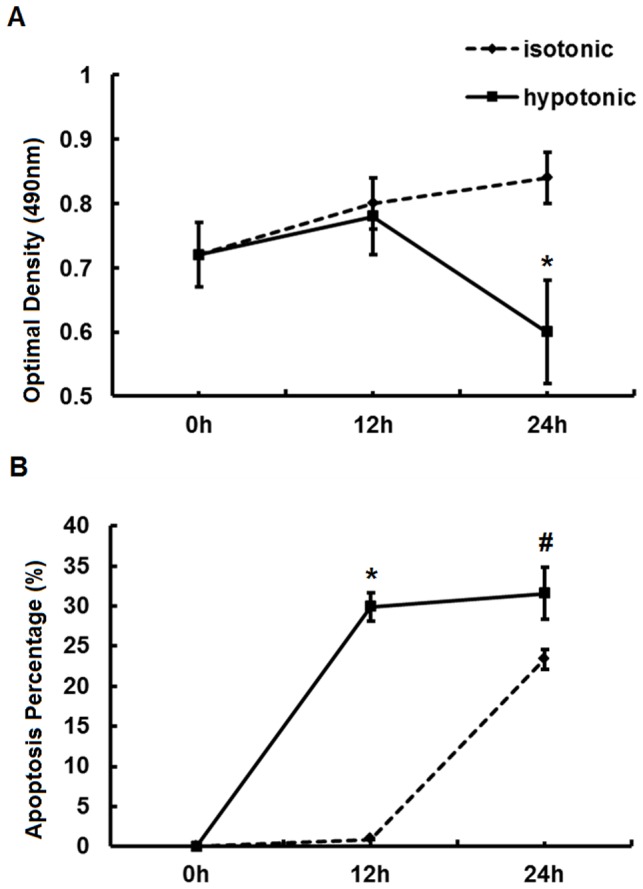
Figure 1. Proliferation and apoptosis assessed by MTT assay and FACS analysis respectively.

(A) MTT assay assessing the proliferation of IMCD cells exposed to hypotonic or isotonic stress for 0 h, 12 h and 24 h. (B) FACS assessing the apoptosis percentage of IMCD cells exposed to hypotonic or isotonic stress for 0 h, 12 h and 24 h. *, P<0.05 compared with isotonic group. #, P<0.05 compared with isotonic group. Error bars represent the standard deviations based on three independent replicates.
