
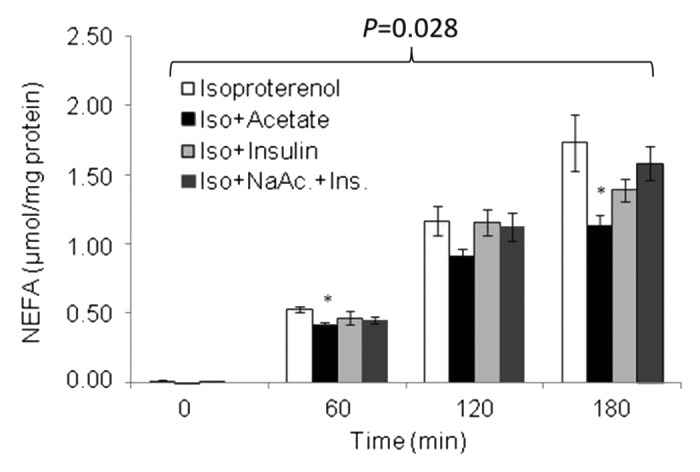
Figure 2. Temporal pattern of NEFA release following isoproterenol stimulation, in the presence of acetate, insulin, and NaAc.+Ins. Values are mean ± SE, *P < 0.05 vs. isoproterenol. P = 0.028 indicates an increase in NEFA over time. n = 3–8 .
Official websites use .gov
A
.gov website belongs to an official
government organization in the United States.
Secure .gov websites use HTTPS
A lock (
) or https:// means you've safely
connected to the .gov website. Share sensitive
information only on official, secure websites.
Figure 2. Temporal pattern of NEFA release following isoproterenol stimulation, in the presence of acetate, insulin, and NaAc.+Ins. Values are mean ± SE, *P < 0.05 vs. isoproterenol. P = 0.028 indicates an increase in NEFA over time. n = 3–8 .