
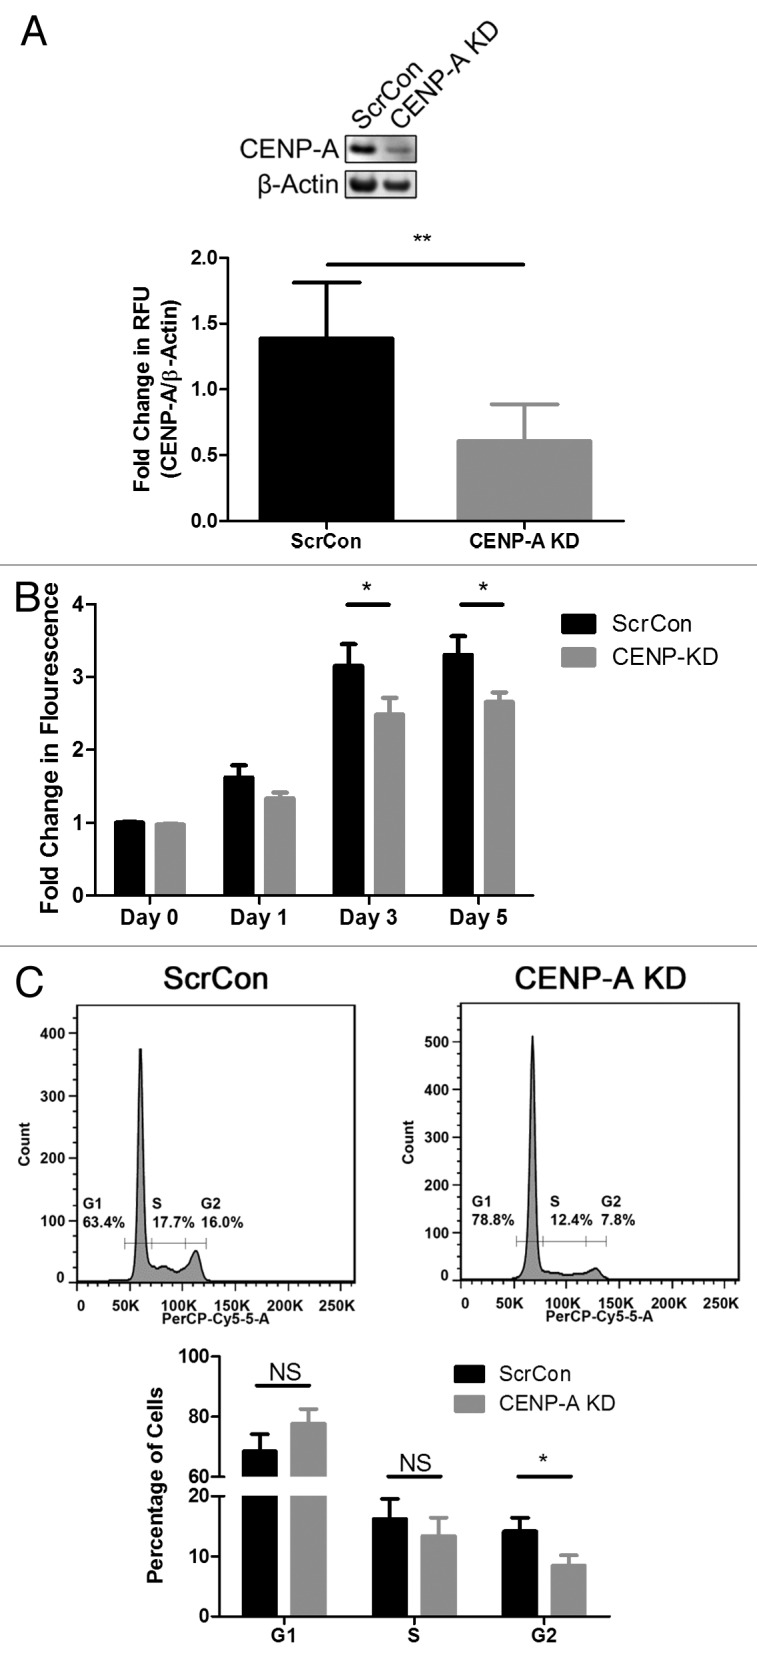
Figure 3. CENP-A silencing slows CPC proliferation. (A) Representative immunoblot showing effective CENP-A knockdown via shRNA (CENP-A KD). Quantification shown in lower panel (n = 3). (B) CyQUANT assay showing slowed growth rate in CENP-A KD CPCs (n = 3). (C) Cell cycle analysis of CENP-A KD CPCs reveals the number of cells in G2 is significantly reduced. Representative histograms shown in top panel, quantification given in lower panel (n = 3). *P < 0.05; **P < 0.005; NS, not significant.