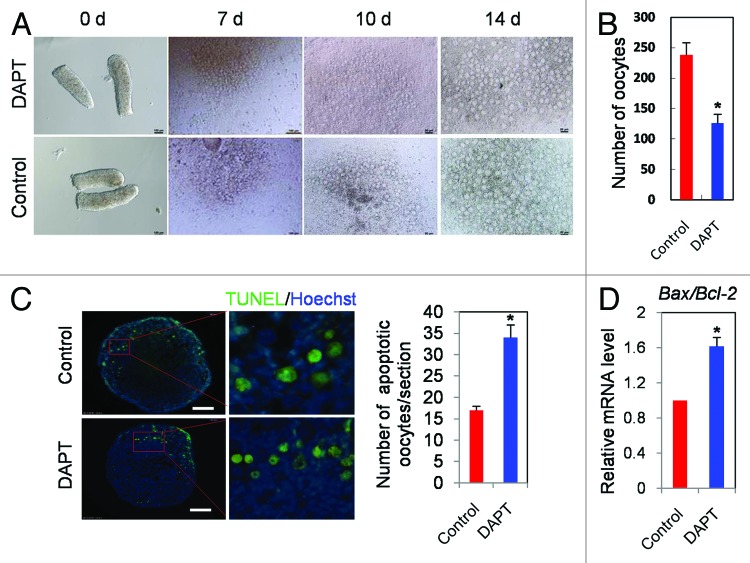
Figure 5. Inhibition of Notch signaling increases oocyte apoptosis. (A) Morphology of 12.5 dpc ovarian tissues cultured for 0, 7, 10, and 14 d in the presence or absence of DAPT. (B) Number of oocytes scored after 14 d. (C) TUNEL-stained ovarian tissues after 14 d; a magnification of the area delimited by the red lines and an histogram with the percentage of TUNEL positive oocytes are shown. (D) Quantitative RT-PCR of Bax and Bcl-2 performed on oocytes isolated from 12.5 dpc ovarian tissues after 14 d. Graphs represent the average ± SD of samples in triplicate from 3–5 experiments. *P < 0.05; **P < 0.01.

An official website of the United States government
Here's how you know
Official websites use .gov
A
.gov website belongs to an official
government organization in the United States.
Secure .gov websites use HTTPS
A lock (
) or https:// means you've safely
connected to the .gov website. Share sensitive
information only on official, secure websites.
