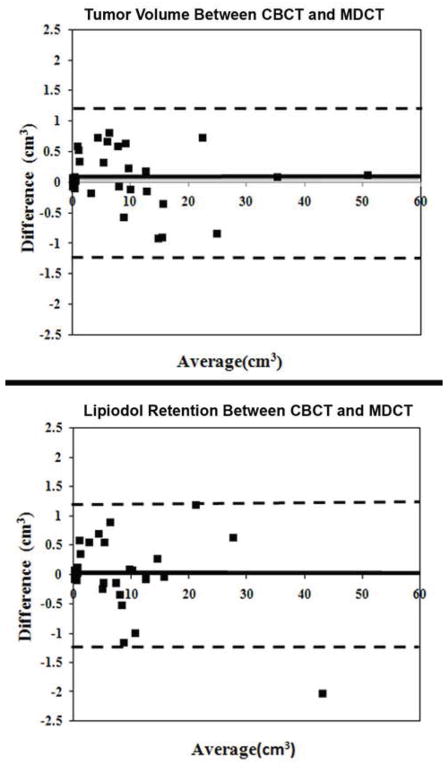
Figure 3.
Bland-Altman plots comparing tumor volume, lipiodol retention between CBCT and MDCT. These plots graphically show the agreement between the two measurement methods. The heavy line is the mean difference and the dashed line is ±2 standard deviations. As shown by the plots, different modalities show excellent agreement, and the low variability.

