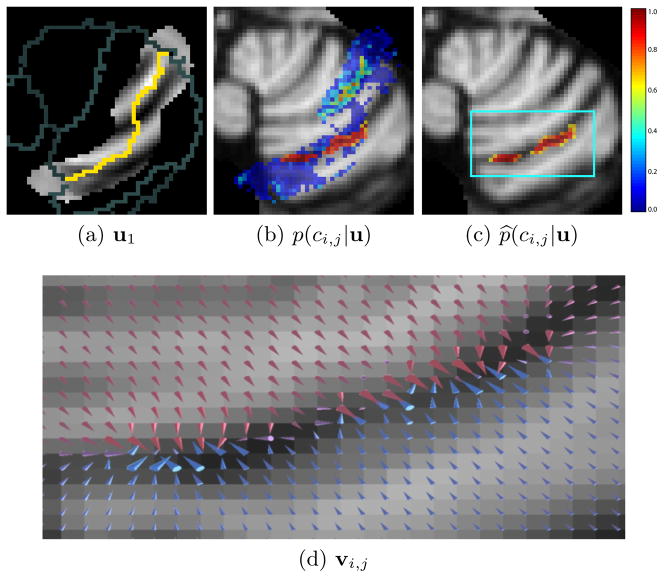
Fig. 2.
A trained classifier is given image features, one of which is shown in (a). The yellow pixels show the current estimate of the boundary to be evolved, while gray pixels show other nearby boundaries. The classifier produces a probability map shown in (b) indicating how likely it is that a given voxel lies on the boundary between two lobules. The topology of this probability map is corrected, the result of which is given in (c). Finally a GVF field is computed from the topologically correct probabilities as shown in (d). The arrows of the GVF are scaled by the square root of their magnitude and colored according to their y component: blues and reds indicate positive and negative y components, respectively.

