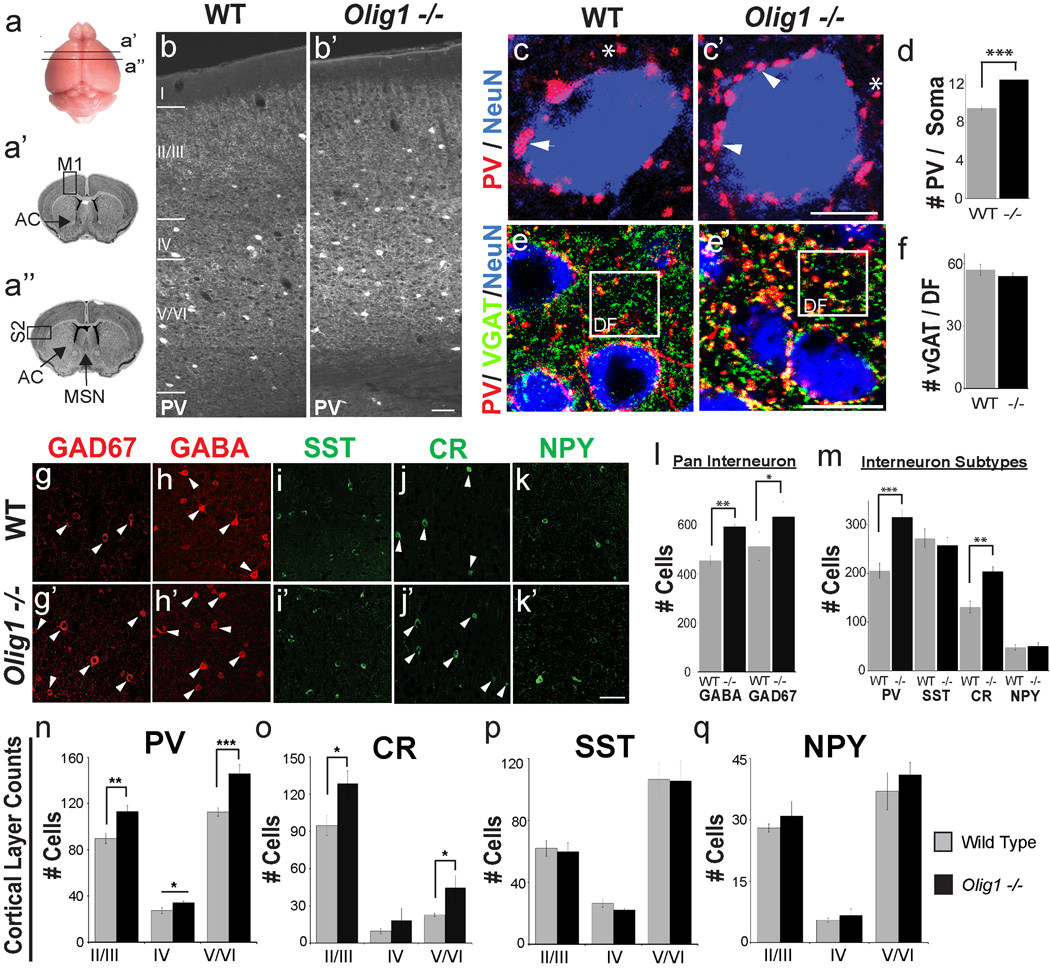
Figure 1. Increase in interneuron numbers in the cerebral cortex of adult Olig1-null mutant mice.
(a) Representation of regions of secondary somatosensory cortex (S2) and primary motor cortex (M1) in which INs were quantified. (b) Representative images of parvalbumin (PV) in wild type (WT) versus Olig1-null (Olig1−/−) motor cortex. Note the increased number of PV+ cell bodies. (c) Representative image showing increases in PV+ (red) synaptic puncta localized to NeuN+ (blue) soma in Olig1−/− vs. WT M1. Arrowheads point to soma localized PV+ puncta, asterisks denote non soma localized puncta. (d) Quantification of PV+ synaptic puncta colocalizing NeuN positive soma in M1 (e) Representative image showing VGAT (green), PV (red), and NeuN (blue). As shown in the boxed region VGAT+ (green) / PV- (red) synaptic puncta in dendritic fields (DF) are identical in Olig1−/− vs. WT M1. Note that PV+ (red) puncta colocalize VGAT confirming they label GABAergic synapses (f) Quantification of the number of VGAT+ puncta in dendritic fields demonstrating that there is not a significant increase in the number of VGAT+ neuronal synapses in dendritic fields of Olig1−/− cortex vs. WT. (g –k) Representative images of INs in Olig1−/− and Wild Type cortex. Arrows point to cell bodies of cell types for which significant differences were observed. (g–h) 2 µm confocal projections of pan IN markers GAD67 (g) and GABA (h). (i–k) 2 µm confocal projections of IN subtype markers Somatostatin (SST) (i), Calretinin (CR) (j), and Neuropeptide Y (NPY) (k). (l–m) Quantification of the number of cells expressing the pan IN markers (l) and IN subtypes (m). Cell counts were taken from micrographs of S2 and M1 in 2 anterior to posterior serial coronal sections as shown in (a). (n–q) Quantification of the number of cells expressing IN subtypes within distinct lamina of the cortex (II/III, IV, V/VI) as demonstrated in panel (b). Cell counts were taken from micrographs of S2 and primary M1 (For all quantifications: mean +/− SEM, n = 3–4; *p<.05, **p<.01, ***p<.005; 2 tailed unpaired student’s t test). (b’,e’,k”) Scale bar = 50 µm, (c’) scale bar = 5 µm (k”), (e’) scale bar = 15 µm. Abbreviations: AC, anterior commissure; DF, dendritic field; IN, interneuron; M1, primary motor cortex; MSN, medial septal nucleus; S2, secondary somatosensory cortex. See also Figures S1 and S2.

