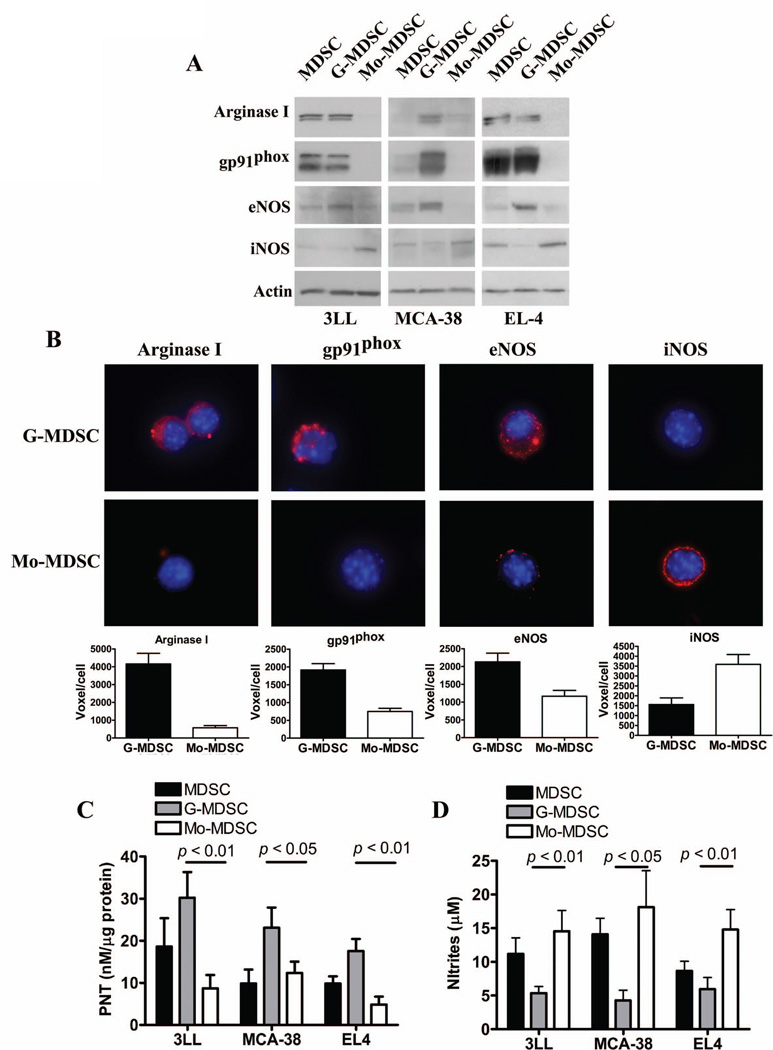
Figure 2. Differential expression of suppressive pathways in tumor-infiltrating MDSC subpopulations.
A. Expression of arginase I, gp91phox, eNOS, and iNOS in MDSC, G-MDSC, and Mo-MDSC isolated from 3LL, MCA-38, and EL-4 tumors. Values are a representative experiment from 5 individual mice. B. The same panel of suppressive enzymes was determined by immuno cytology and the voxel per cell determined, as described in the methods. C. Nitrotyrosine ELISA of whole cell extracts from tumor isolated MDSC subpopulations was used to quantify PNT production (n=10). D. NO production by MDSC subsets was determined using Griess reagent (n=10).

