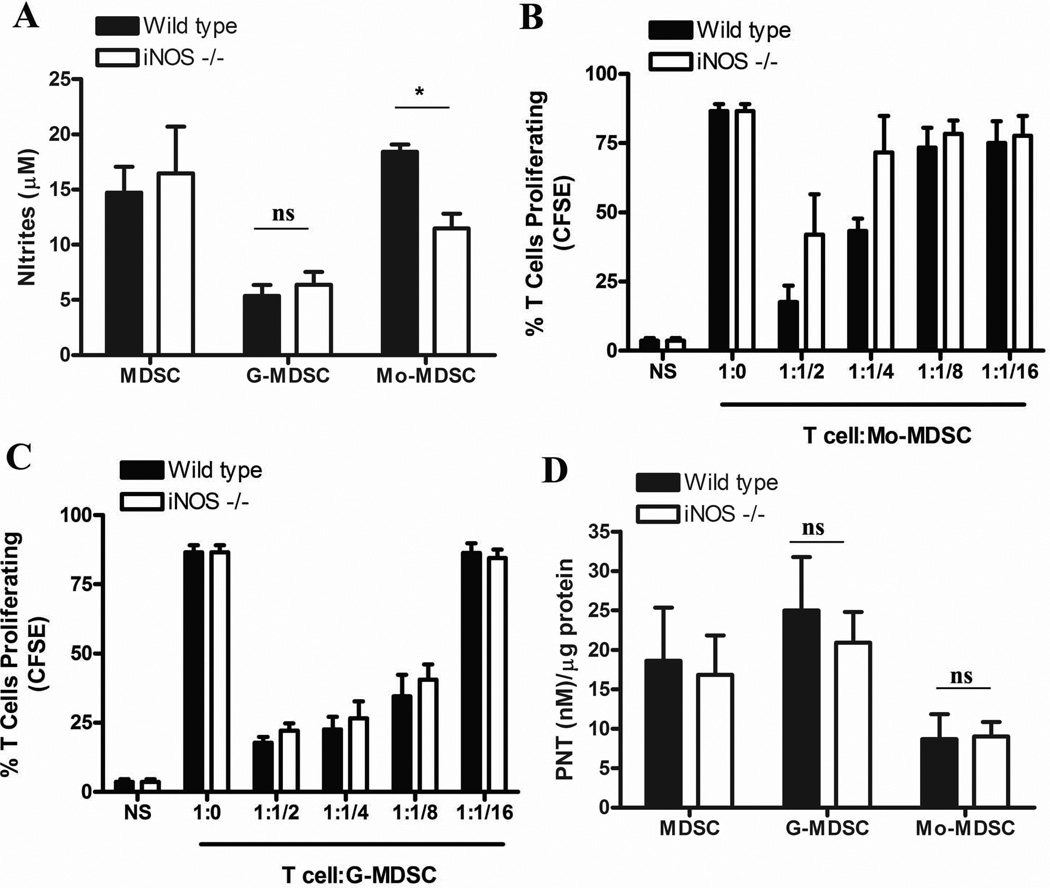
Figure 5. Mo-MDSC suppress T cell proliferation by NO production derived from iNOS.
A. Comparison of nitrities from G-MDSC and Mo-MDSC isolated from wild-type and iNOS−/− mice bearing 3LL tumors for 17 days (n=10). B–C. Mo-MDSC (B) and G-MDSC (C) were collected from wild-type and iNOS−/− mice bearing 3LL tumors and co-cultured with CFSE labeled T cells. Proliferation of T cells was established 72 hours later. The experiment was repeated a minimum of 3 times obtaining similar results. D. PNT production from each population was analyzed by nitrotyrosine ELISA (n=9). * p < 0.01; Non-statistical significant differences (ns): p > 0.05

