
Figure 1. Recording DA release from NAc using fast scan cyclic voltammetry.
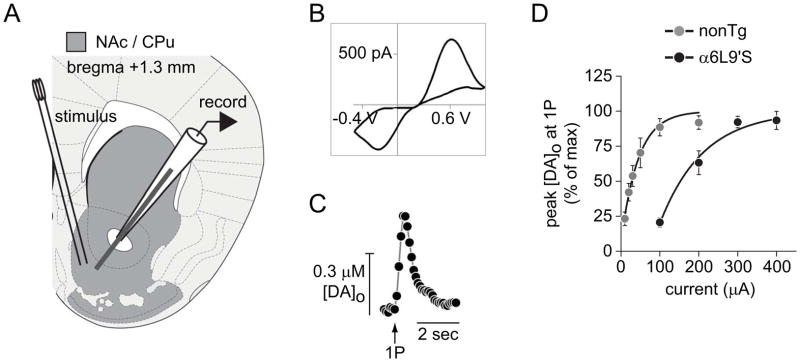
A) NAc recording site. Brain slices from α6L9’S and nonTg mice were prepared at the indicated coordinates. Carbon fiber electrode and stimulating electrode were placed approximately as indicated.
B) A representative cyclic voltammogram is shown from a recording of electrically-evoked DA release from NAc slices.
C) A representative plot of the peak oxidative (+0.6V) current versus time is shown for an evoked DA release event.
D) Input/output curve for DA release from nonTg and α6L9’S NAc slices. DA release from the indicated genotype was electrically evoked with a range of current values. The peak [DA]o data from each genotype were normalized, plotted, and fitted to an exponential function.