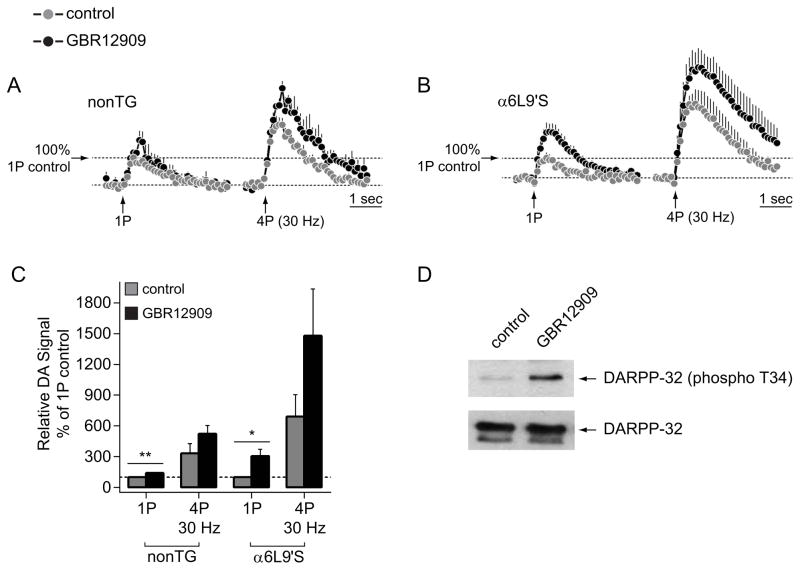
Figure 3. DA re-uptake is intact in α6L9’S NAc.
A) Peak oxidative current vs. time is shown for DA release responses from nonTg NAc slices before and after bath application of GBR12909 (2 μM). Responses following both 1P and 4P (30 Hz) stimulations were recorded. The number of responses was: 1P control, n=5; 1P GBR, n=5; 4P control, n=5; 4P GBR, n=5.
B) Peak oxidative current vs. time is shown for DA release responses from α6L9’S NAc slices before and after bath application of GBR12909 (2 μM). Responses following both 1P and 4P (30 Hz) stimulations were recorded. The number of responses was: 1P control, n=5; 1P GBR, n=5; 4P control, n=5; 4P GBR, n=5.
C) Relative DA signal values are shown for the 4 conditions X 2 genotypes shown in A) and B). The area under the peak oxidative current vs. time curve was derived for all conditions in A) and B), and data from nonTg and α6L9’S NAc were normalized to their respective 1P pre-drug control values. **p<0.01, *p<0.05
D) DARPP-32 western blot. Slices from nonTg mice containing dorsal striatum and NAc were treated with control ACSF or ACSF containing GBR12909 (2 μM) for 10 min. Tissue samples were prepared for western blot analysis, and blots were probed with the indicated antibodies.

