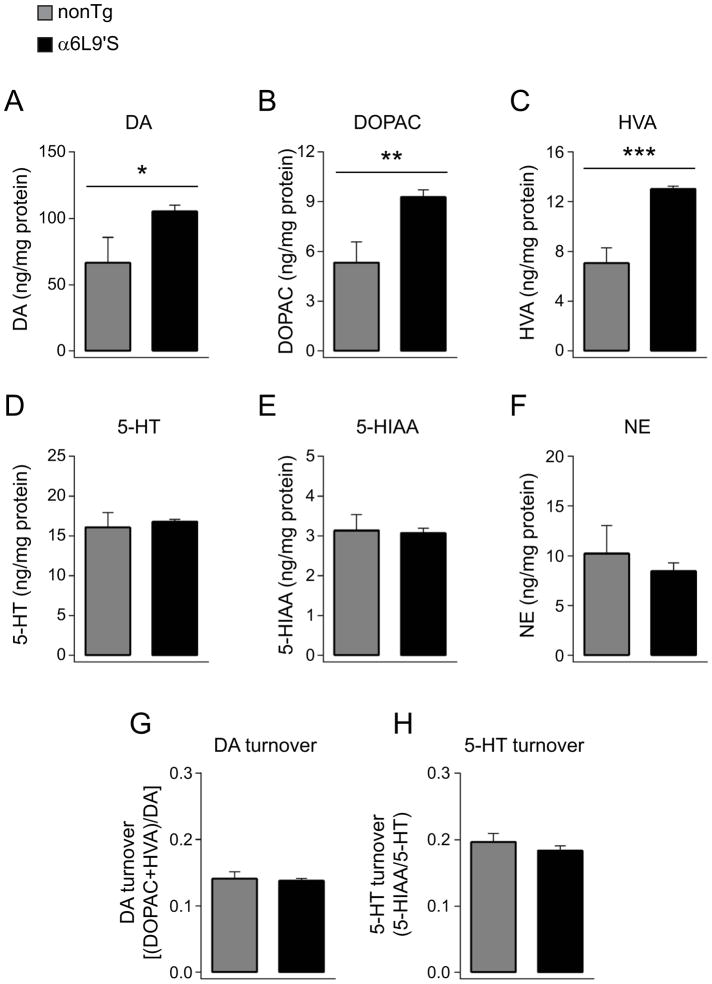
Figure 6. Increased tissue DA content in α6L9’S NAc. NAc tissue was prepared from α6L9’S (n=7) and nonTg (n=4) mice, followed by analysis of the indicated chemical species via HPLC.
A) DA levels in NAc of α6L9’S and nonTg mice. *p<0.05
B) DOPAC levels in NAc of α6L9’S and nonTg mice. **p<0.01
C) HVA levels in NAc of α6L9’S and nonTg mice. ***p<0.001
D) 5-HT levels in NAc of α6L9’S and nonTg mice.
E) 5-HIAA levels in NAc of α6L9’S and nonTg mice.
F) NE levels in NAc of α6L9’S and nonTg mice.
G) DA turnover in each α6L9’S and nonTg NAc sample was calculated.
H) 5-HT turnover in each α6L9’S and nonTg NAc sample was calculated.

