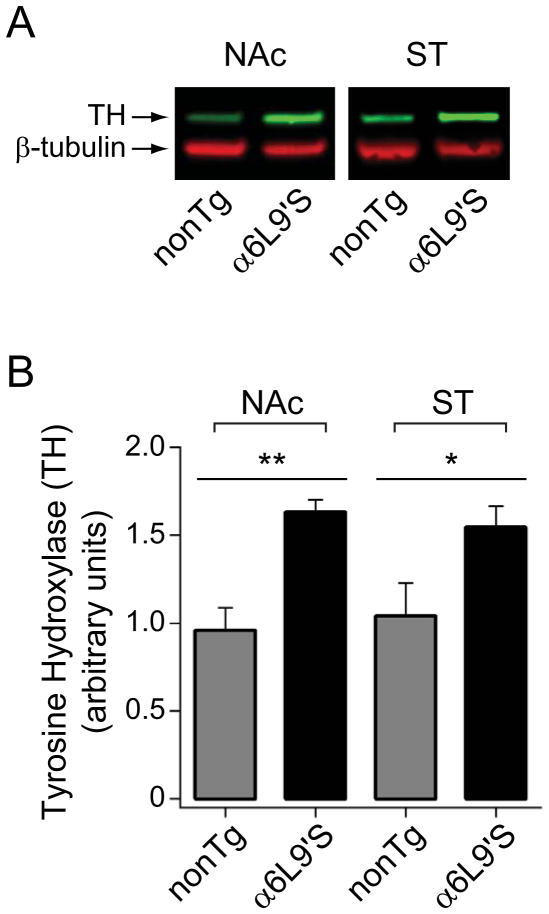
Figure 7. Increased expression of tyrosine hydroxylase (TH) in NAc and dorsal striatum of α6L9’S mice. Tissue was prepared as for HPLC, and was extracted for western blot analysis.
A) Representative western blot for TH in α6L9’S and nonTg NAc and ST tissue. β-tubulin was probed as a loading control.
B) Quantification of TH western blot results in NAc and ST. TH and β-tubulin blot intensity for each α6L9’S and nonTg sample was derived. TH was normalized to β-tubulin loading for each sample, and values for normalized TH expression is plotted for α6L9’S and nonTg NAc. Number of observations was: NAc (nonTg, n=3; α6L9’S, n=7), ST (nonTg, n=4; α6L9’S, n=7). **p<0.01, *p<0.05

