Fig 4.

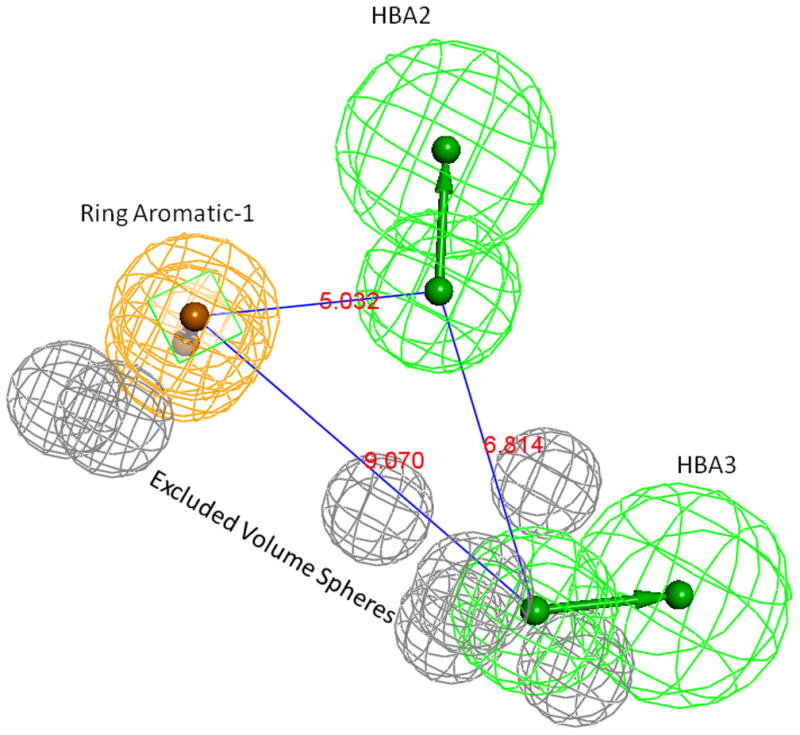
Pharmacophore model-06. Grey spheres indicate the excluded volumes, Green spheres are HBA and the Ring-Aromatic feature is shown in orange color spheres. Supplementary pages show the model with exclusion spheres.

Pharmacophore model-06. Grey spheres indicate the excluded volumes, Green spheres are HBA and the Ring-Aromatic feature is shown in orange color spheres. Supplementary pages show the model with exclusion spheres.