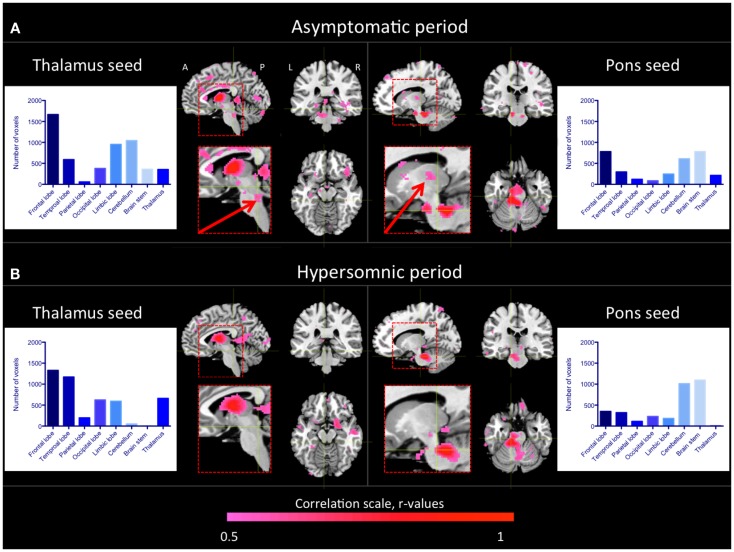
Figure 2.
Thalamic and pontine functional connectivity in the KLS patient during asymptomatic and hypersomnic periods. The color scale represents correlation coefficients, r > 0.5. The inserts show magnifications of the brain stem and thalamus. The arrows point to connections between the brain stem and the thalamus that were reduced in the patient during hypersomnia. The histograms show the number of connected voxels to the thalamus and pons, respectively, during both asymptomatic (A) and hypersomnic (B) periods. A, anterior; P, posterior; L, left; R, right.

