Figure 1.

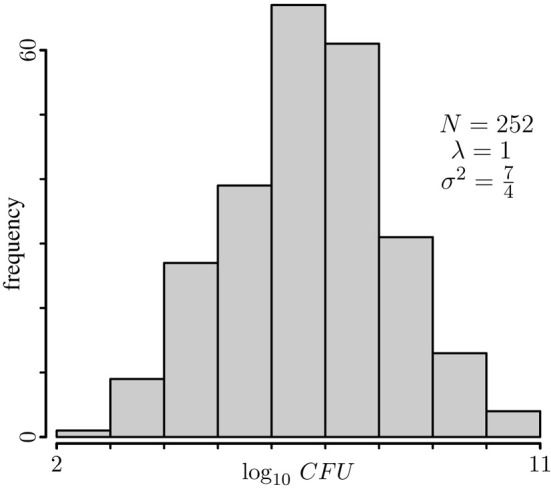
Typical histogram of simulated data. The p-value profiles of the data on this histogram were computed and plotted in Figure 2.

Typical histogram of simulated data. The p-value profiles of the data on this histogram were computed and plotted in Figure 2.