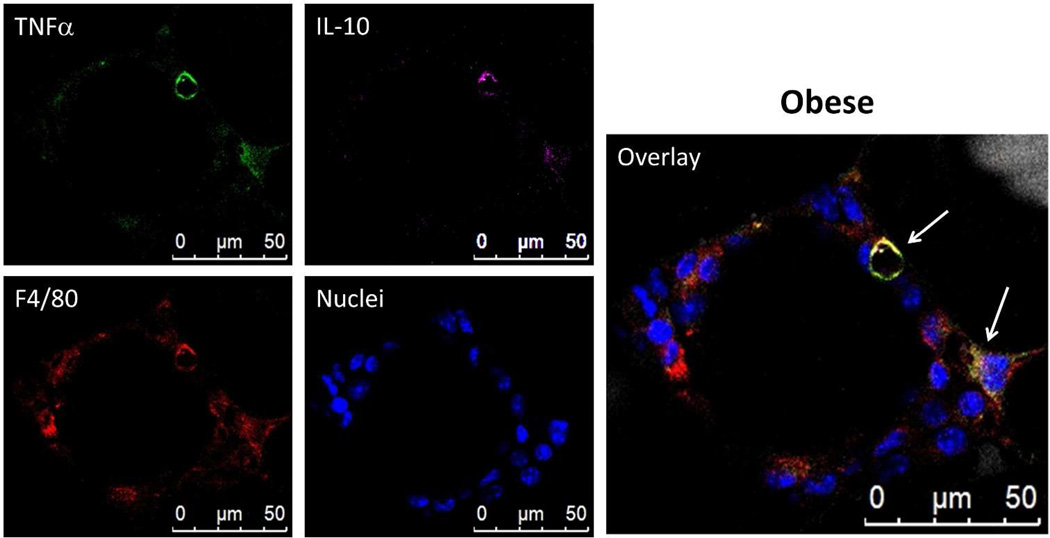
Figure 2.
Most CLS macrophages express TNFα while a few express both TNFα and IL-10. Images presented are a LSCM 2D projection of a 3D image stack. Adipose tissue from obese mice that was fixed and stained with BODIPY 558/568 for lipid (gray), Hoechst for nuclei (blue), anti-F4/80 for macrophages (red), anti-TNFα (green), and anti-IL-10 (magenta). The panel shows a four micron 2D projection captured with a 63× objective. The majority of CLS macrophages produce TNFα and some appear to produce both TNFα and IL-10 (arrows) while others have no cytokine expression (F4/80 only).

