Figure 6.
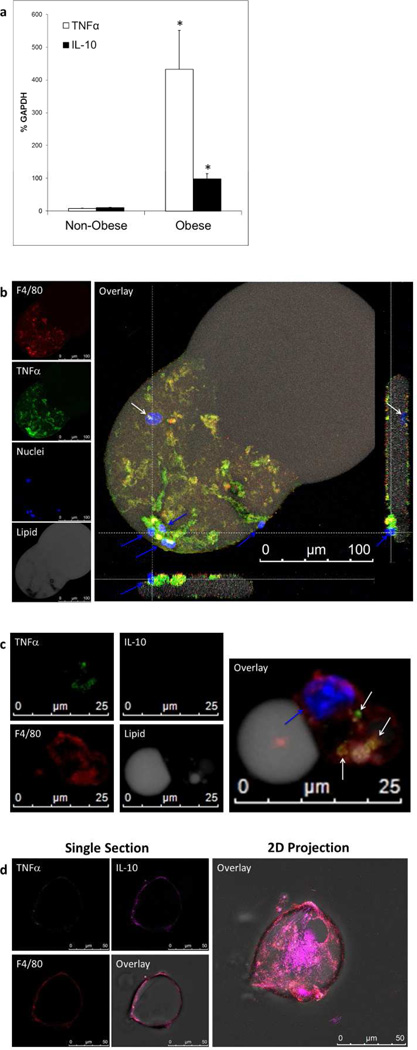
The adipocyte floating layer has high expression of TNFα and IL-10 in obese mice compared to non-obese mice. (a) qRT-PCR of floating layer cells showing relative amounts of TNFα compared to IL-10 mRNA normalized to GAPDH. Obese mice had a 40-fold increase in TNFα (open boxes) while only inducing a 10-fold increase in IL-10 production (black boxes). * p<0.05 in all figures. (b) Floating layer adipocyte with attached macrophages. Floating layer cells stained with BODIPY (gray) for lipid to denote adipocytes, F4/80 (red) for macrophages, TNFα (green), IL-10 (magenta), and nuclei (blue). There was no IL-10 expressed in either cell type in this example (field not shown). TNFα can clearly be seen to be associated with only the macrophages, but not the adipocyte (F4/80 vs. TNFα panels and overlay). The adipocyte nucleus is indicated by the white arrow in the overlay and right side view, while macrophage nuclei are indicated by the blue arrows. The figure is an LSCM 2D projection of a 3D image stack using a 63× objective. The side views are 1um thick sections imaged from the corresponding dotted white lines parallel to the section.(c) Macrophages in the floating adipocyte layer ingest lipid and produce TNFα. At high magnification using LSCM and 63× objective a 2D projection shows a macrophage (red) with a single nucleus (blue arrow) remained attached to and ingested lipid (gray) in the floating layer. TNFα (green) expression was associated with the macrophage (white arrows) and not the attached or ingested lipid. No IL-10 is produced. (d) Floating layer macrophage(s) with engulfed lipid produced IL-10 to a lesser extent. Individual panels (left) show a one micron section of a LSCM image using a 63× objective. The floating layer cells were stained for F4/80 (red), TNFα (green) and IL-10 (magenta) and the overlay depicts all of these fields plus a brightfield image. The macrophage, shown with engulfed lipid, is expressing mostly IL-10, but there is some expression of TNFα. A 2D projection of the LSCM image shows the extent of IL-10 production in the macrophage surrounding the lipid.

