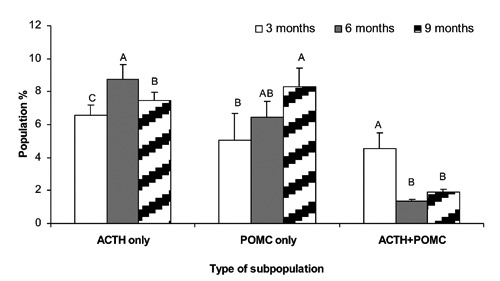
Figure 3.

Mean ± SEM proportion of corticotroph cells subpopulation at 3 months (plane white), 6 months (plane gray) and 9 months of gestation (white, hatched) fetuses. A-C, superscript letters indicate significant differences between animal age groups or between cell types (P≤0.05).
