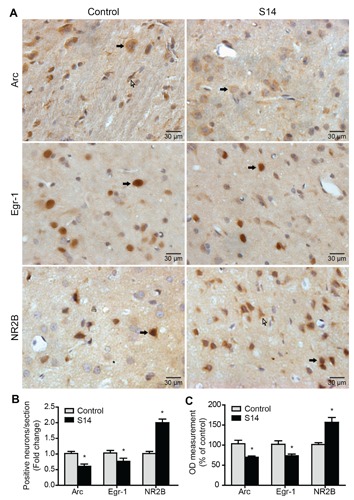
Figure 3.

The expression of Arc, Egr-1 and NR2B was evaluated using immunohisto-chemistry staining (magnification 400×) in the IC. A) Immunohistochemical staining of Arc, Egr-1 and NR2B in the IC. Black arrows indicate neurons and white arrows indicate glia. B) The number of Arc, Egr-1and NR2B positively stained cells in IC. C) Bars show percentage difference in OD compared to the control group (100%). Values are given as mean ± SD, n=6.*P<0.05 vs the control group. Scale bars: 30 μm.
