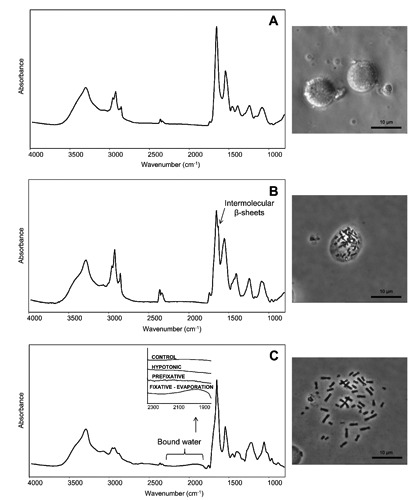
Figure 2.

FTIR absorption spectra of cultured lymphocytes at each stage of chromosome preparation: A) after the hypotonic treatment; B) after prefixation stage with Ibraimov solution; C) after the fixative treatment with a solution of methanol:glacial acetic acid 2:1 followed by the final evaporation. The spectra are shown after correction of the Mie scattering and smoothing. The phase contrast microscopy images acquired upon the different procedure stages are also reported. In C, a magnification of the spectral range between 2300 and 1800 cm–1 due to bound water is also reported.
