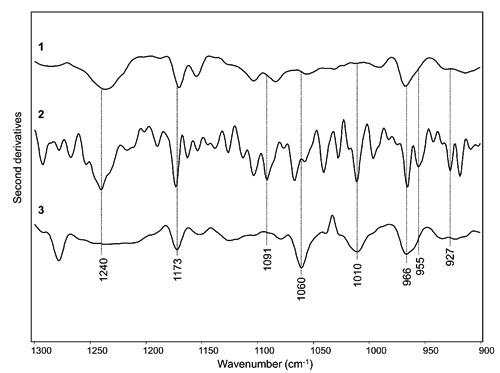
Figure 4.

FTIR second derivative spectra of (1) intact lymphocytes (control); (2) sample after prefixative stage; (3) sample after the fixative-evaporation stage between 1300-900 cm–1. Spectra are the same of Figure 3, and they have been displayed after normalization at the tyrosine peak around 1515 cm–1.
