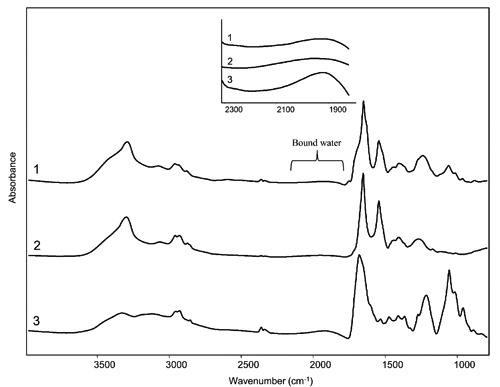
Figure 5.

FTIR absorption spectra of cultured lymphocytes (1), albumin (2) and calf thymus DNA (3) after the fixative treatment with a solution of methanol:glacial acetic acid 2:1 followed by evaporation. The spectra are shown after correction of the Mie scattering and smoothing. A magnification of the spectral range between 2300 and 1800 cm–1 due to bound water is also reported.
