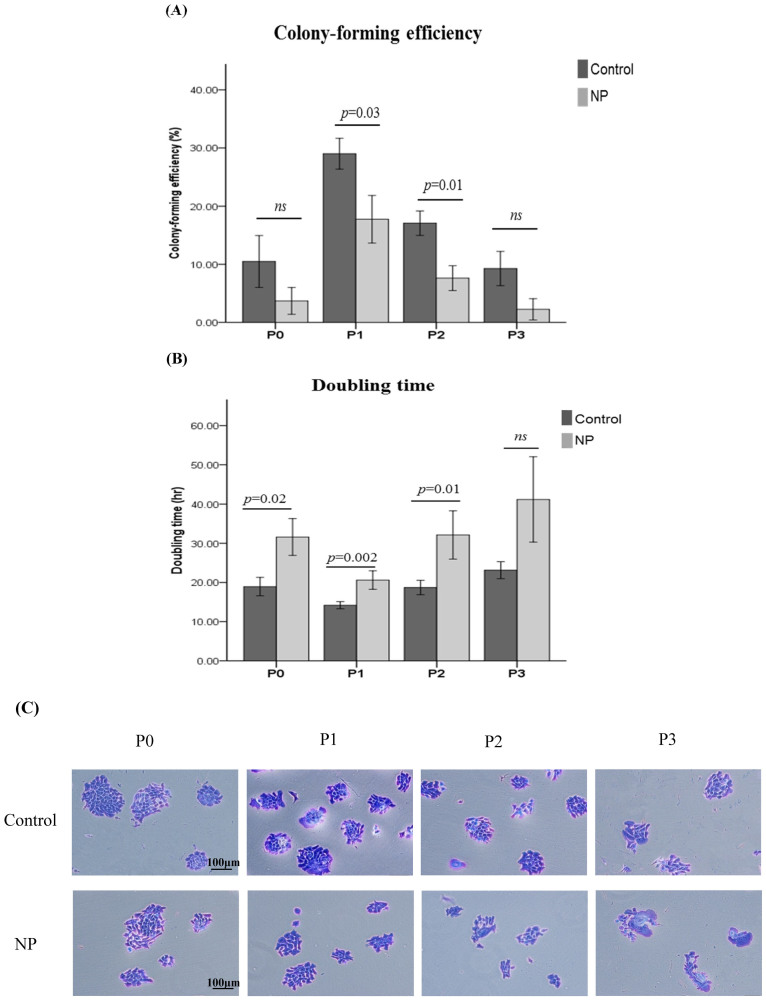
Figure 2. Comparisons of CFE and doubling time at each passage (P0 to P3) of the hNESPCs from NP versus healthy controls.
The value of CFE was given as a percentage (A) and the values of doubling time (hour) are shown in panel (B). Clustered column charts are shown with mean plus 95% confident interval (CI). Statistical analyses were performed with the linear mixed models. P values were considered significant at less than 0.05. Representative staining pictures of colonies over subsequent passages in cultures from NP and controls (C). Original magnification 100× (scale bar = 100 μm).

