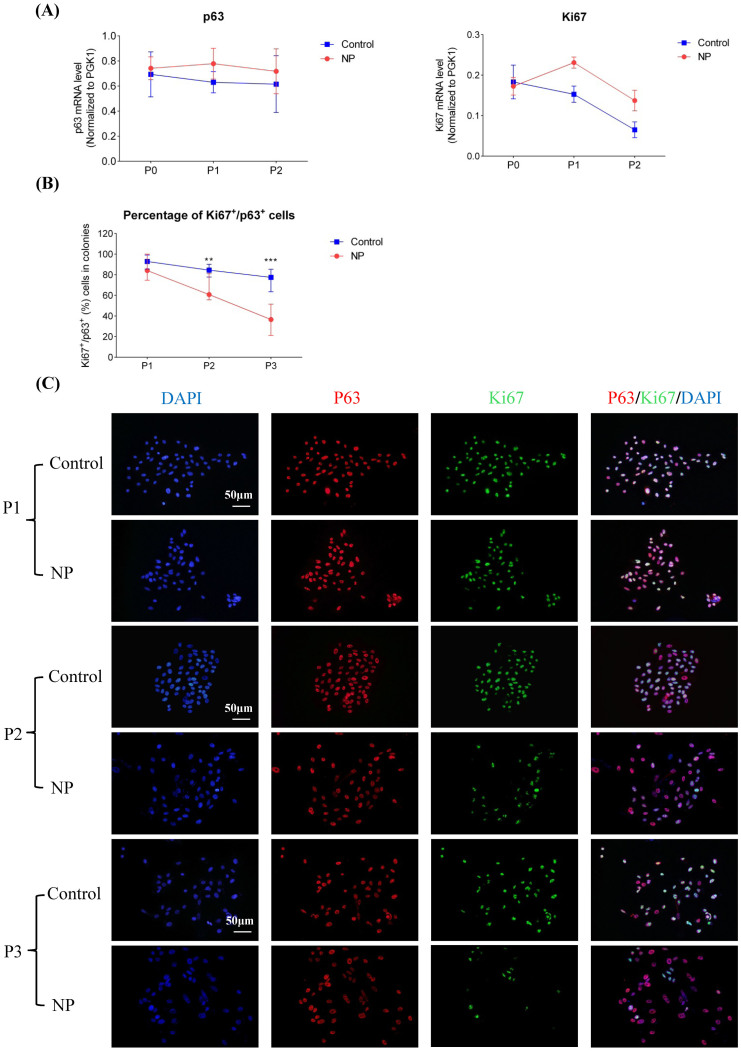
Figure 3. Comparisons mRNA/protein levels of p63 and Ki67 at different passages (P0 to P3) of the hNESPCs from NP versus healthy controls.
p63 and Ki67 mRNA levels were determined by means of real-time RT PCR (panel A). All target mRNA relative expression levels were given as ratios of PGK1 transcript levels. Line charts are shown with mean ± SE. p63 and Ki67 protein levels were determined by means of immunofluorescence assay (B). Mann-Whitney test was used to analyze the difference of Ki67+/p63+ cell percentage in colonies between NPs and controls at each passage. Symbol “**” means the p-value is less than 0.01, while symbol “***” means the p-value is less than 0.001. Representative pictures show the p63/or Ki67 single-positive cells and p63/Ki67 double-positive cells (panel C). Original magnification 200×. (scale bar = 50 μm).

