Figure 1.

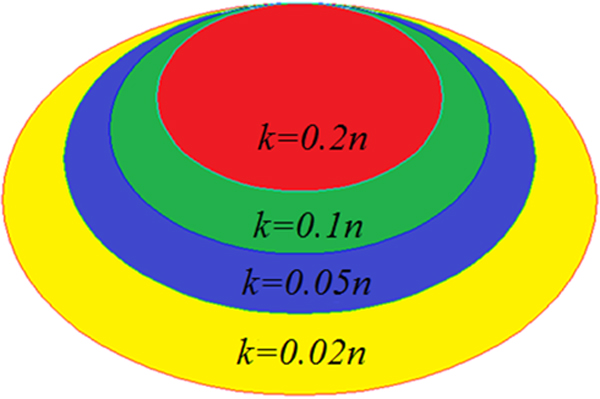
Diagram for the sparsity control using in SRVS method. is the total number of columns/variables. The results were generated with white noise simulation data set (size 100 × 1e6; 50 cases, 50 controls and 1e6 variables).

Diagram for the sparsity control using in SRVS method. is the total number of columns/variables. The results were generated with white noise simulation data set (size 100 × 1e6; 50 cases, 50 controls and 1e6 variables).