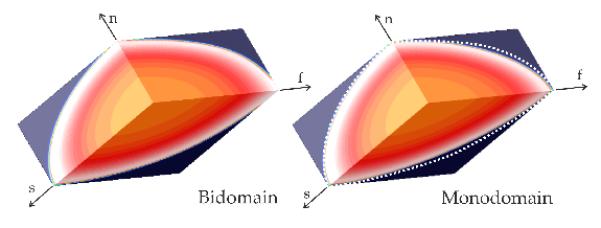
Figure 1.

Comparison between bidomain and an equivalent monodomain model in a 3D slab model. White dashed lines in the Monodomain panel indicate position of the wavefront in a bidomain setting for the same instant in time. f, s and n are orthotropic main axes.
