
Figure 2.
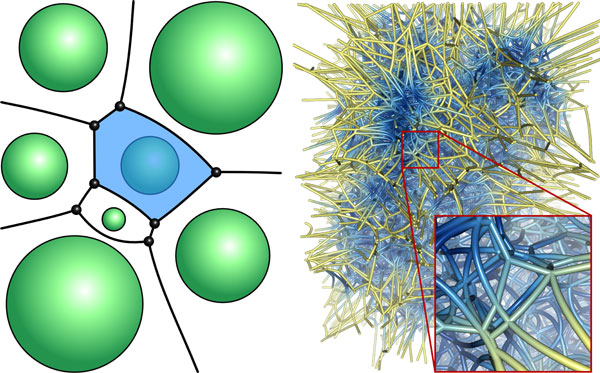
Voronoi diagram. In the left image, a two-dimensional illustration of a Voronoi diagram of spheres is shown. A single Voronoi region has been highlighted in blue. On the right side, the Voronoi diagram of spheres for a selected time step of the bacteriorhodopsin trajectory is shown. The Voronoi edges and vertices were cut with the bounding box of the protein, and the edges have been colored with respect to the distances to the van der Waals surface of the protein. Here, blue corresponds to small distances and yellow to large distances.