
Figure 5.
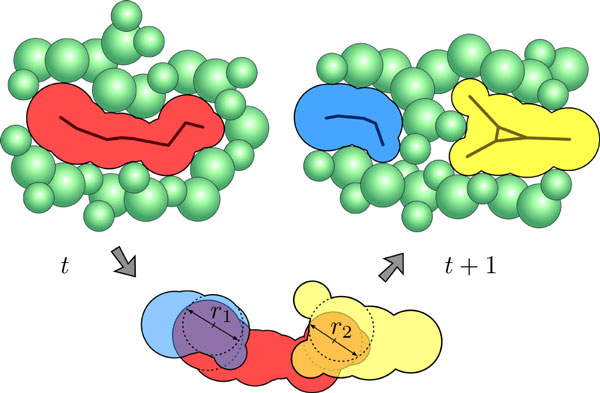
Illustration of the path tracing algorithm in 2D. The red component of time step t intersects with the blue and yellow components of time step t + 1. The maximal radii of these intersections are r1 and r2, respectively, depicted by the arrows. Since both radii are larger than the user-defined minimal radius of the intersection sphere, a split event is detected by the tracing algorithm.