
Figure 9.
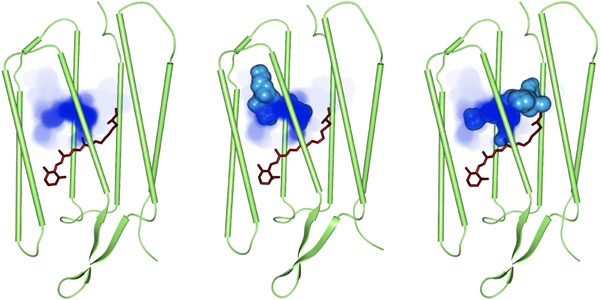
Residence probability of a single dynamic cavity in bacteriorhodopsin. The residence probability of the traced dynamic cavity is displayed using the maximum intensity projection. In the middle and right images, the static cavities together with the dynamic cavity at two different time steps are shown as skin surface.