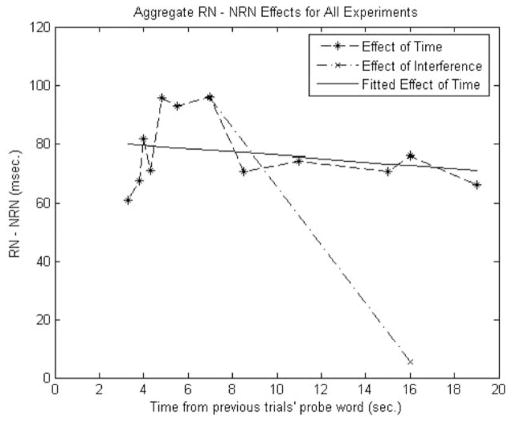
Figure 7.
Aggregated data from all experiments. The dashed line with asterisks represents the aggregated data according to delay time across all our studies. The solid line is the linear fit of the effect of delay time on the recent negative–nonrecent negative (RN–NRN) contrast. The dashed line with Xs represents the effect of interference (i.e., taking the two-back probe as the RN probe on the current trial). From the figure one can see the stronger effect of interference compared with time-based decay.

