
Figure 2.
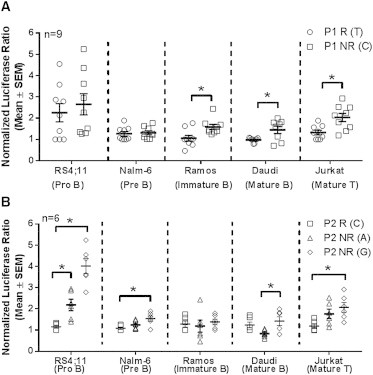
Both P1 and P2 Variants Affect BLK-Promoter-Driven Transcriptional Activity
Mean and standard error of measure (SEM) are displayed in the center, and probability density functions are represented by the sides. The effect of P1 variant with either risk or nonrisk P2 haplotype on overall luciferase expression (A) and the transcriptional activity in cell lines transfected with reporter vectors carrying one of the three SLE-associated P2 variants with a nonrisk P1 (B) is shown. Nine transfections of each vector carrying the P1 allele being compared were performed in each model cell line (n = 9), and triplicates were assessed for luciferase activity to give normalized means for each transfection. P1 risk [R(T)] and nonrisk [NR(C)] variants are compared (mean ± SEM). P2 variants of each allele (G, A, or C) were assessed in six experiments. Normalized luciferase ratio = (normalized luciferase activity of the haplotype)/(normalized luciferase activity of the T allele at P1 − the luciferase activity of the C allele at P2). The normalized luciferase activity for the haplotype = luciferase activity of BLK:pGL4/luciferase activity of TK:pRL. ∗p < 0.05 in a paired t test. Means ± SEM are shown.