
Figure 6. Group Regression Map.
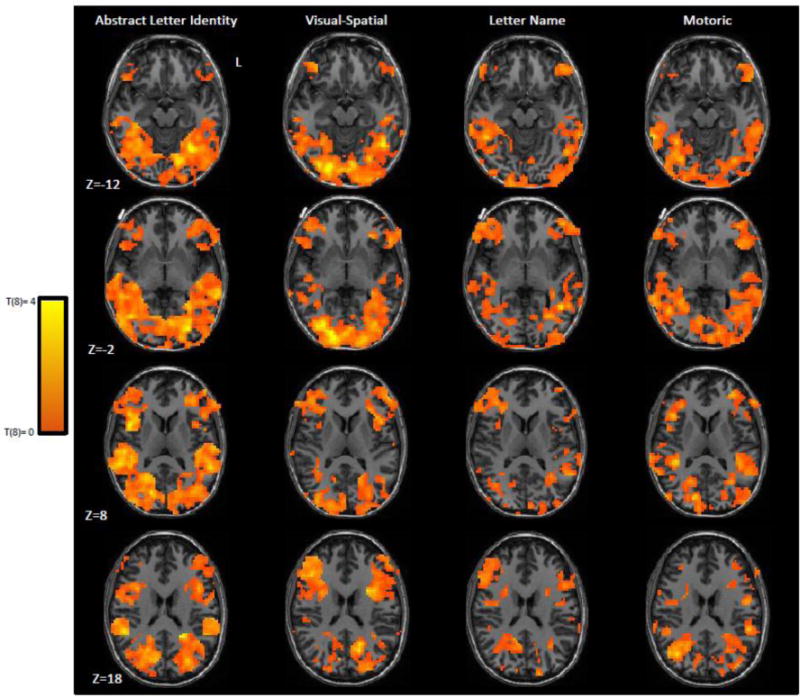
Each group regression map was obtained by carrying out, at each searchlight volume, a regression analysis to determine the unique contribution of each feature dimension; the resulting beta weights for each dimension were then subjected to a one-way, two-tailed, t-test evaluation. Depicted are 4 horizontal slices from the unthresholded Group Regression Selectivity maps for each of the feature dimensions. Only the Abstract Letter Identity and Visual Spatial feature dimensions yielded significant clusters and these are reported in Table 3.