
Figure 7. The significant clusters identified in each of the three selectivity analyses.
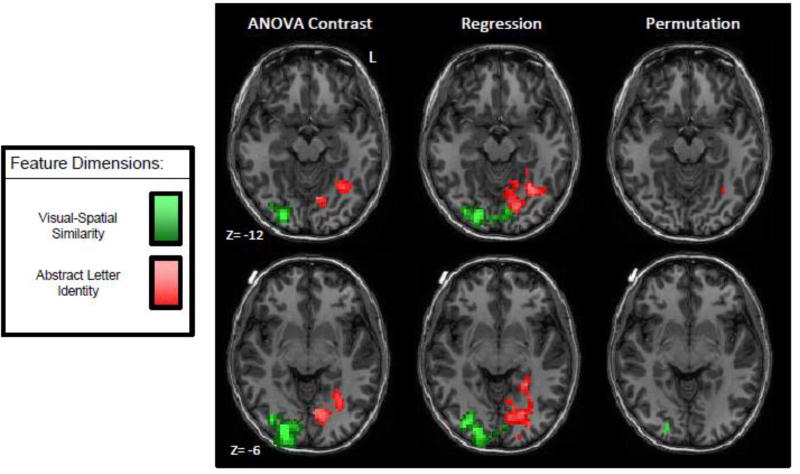
For each of the maps, Visual-Spatial selectivity is depicted in green and Abstract Letter Identity is depicted in red. For the ANOVA comparison significant clusters (uncorrected voxelwise threshold p<0.05; corrected cluster size threshold p<0.05) are shown in a scale where the darker colors indicate lower f-values and lighted colors indicate higher f-values. For the regression analysis significant clusters (uncorrected voxelwise threshold p<0.10; corrected cluster size threshold p<0.05) are shown in a scale where the darker colors indicate lower t-values and lighted colors indicate higher t-values. For the permutation analysis, selectivity maps were thresholded to depict only voxels where all 9 participants showed selective tuning with cluster-size correction for multiple comparisons (p<0.05). Specific details from these analyses are reported in Tables 2–4. The Letter-Name and Motoric feature dimension are not depicted because significant clusters were not identified for these feature dimensions in these analyses.