
Figure 9. Sensitivity of visually similar vs. visually dissimilar cross-case, same identity pairs within the ALI region (in red) identified in the regression analysis.
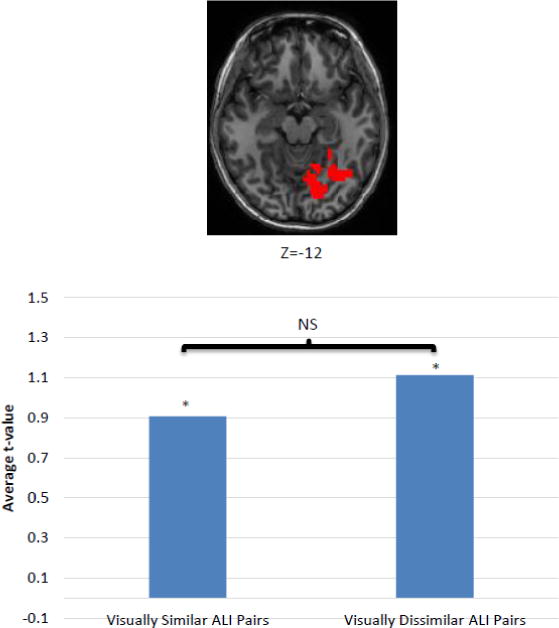
The bar graph depicts the average t-value for voxels within the ALI-selective region for Group Sensitivity Maps based on a pRSM model in which the 6 most visually similar cross-case identity pairs are treated as ALIs and a pRSM in which the 6 most visually dissimilar cross-case identity pairs are treated as ALIs. The results indicate that visually similarity does not determine or influence responsivity to ALI.