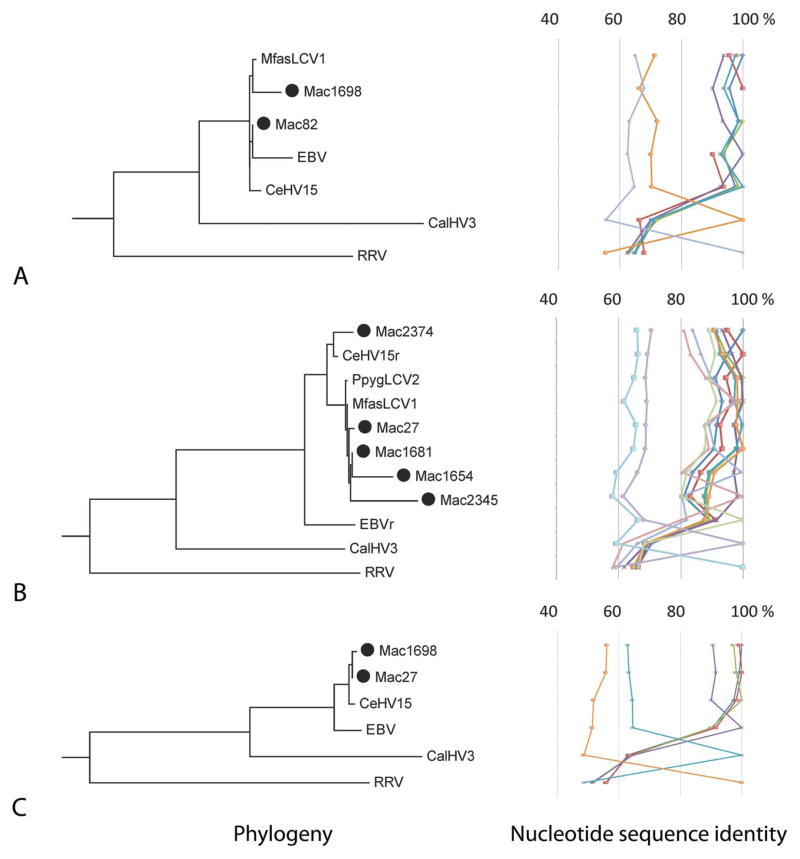
Figure 2.
Phylogenetic trees and nucleotide identity of viral isolates. Phylogenetic tree topologies and percent nucleotide identity between isolates and known gHV types in a given genomic region are shown on the left and right side of each panel, respectively. Panels show maximum-likelihood (ML) tree and percent nucleotide sequence identity derived from partial sequences of the DNA Polymerase (DPOL) region from indicated samples (A); ML tree and percent nucleotide sequence identity for isolates and known gHV types in the gB region (B); and ML tree and percent nucleotide sequence identity for isolates and known gHV types in the major DNA binding protein (MDBP) region (C). Representative sequences for isolates determined in this study are denoted with a black circle in front of the sample name.

