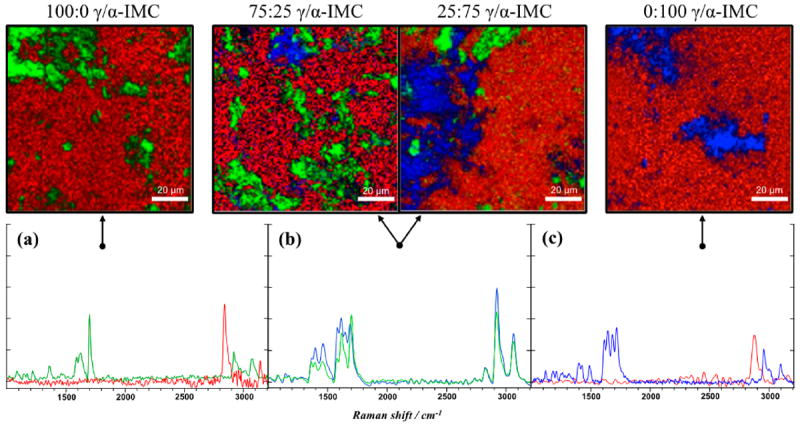
Figure 4.

Top: BCARS pseudocolored images 100 × 100 μm generated from spectral components (R: 2880 cm−1, G: Δ1700–1668 cm−1, B: 1682 cm−1) of Raman spectra for 100:0, 75:25, 25:75, and 0:100 of γ-IMC:α-IMC tablets (from left to right, respectively). Bottom: Raman spectra chosen from pixels found within top images (see arrows) for (a) 100% γ-indomethacin, (b) multicomponent, and (c) 100% α-indomethacin tablets, where spectral line color correlates to pixel color from above the image. Pixel dwell times were 500 ms.
