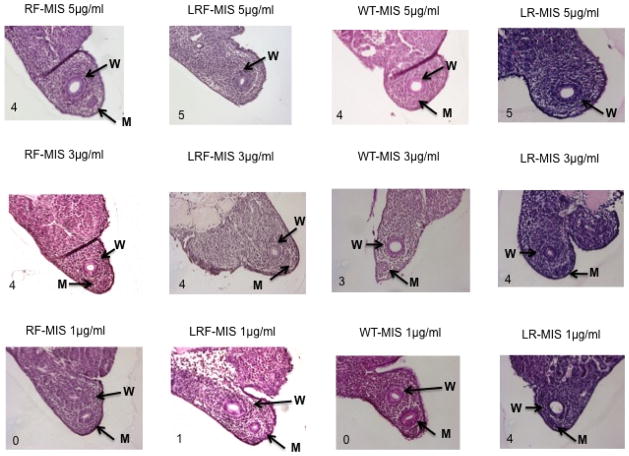
Figure 4.
Comparing RF-MIS, LRF-MIS, WT-MIS, and LR-MIS in a Mullerian duct regression bioassay. MIS was incubated 72 h with fetal rat urogenital ridges and representative sections from the treated ridge are compared for Mullerian duct regression. The scores are indicated at the bottom left corner of each picture, with 5 being full regression and 0 no regression. W, Wolffian duct; M, Müllerian duct. Microscopy pictures were taken with a 200X objective.

