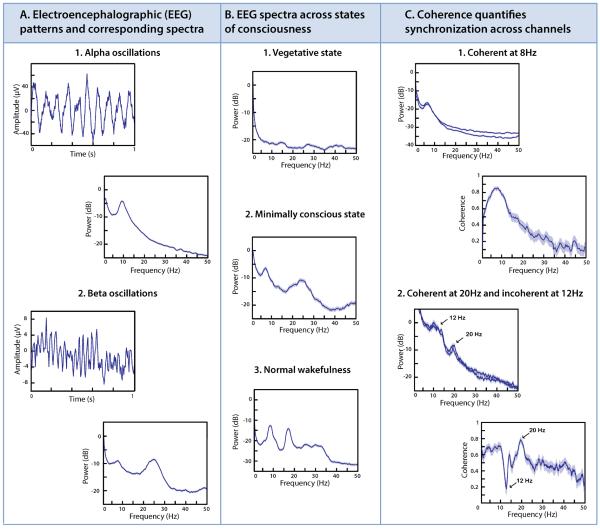
Figure 1. Electroencephalographic (EEG) patterns across states of consciousness.
A. The power spectrum describes the frequency content of a single channel of EEG. The example of panel A1 shows prominent oscillations at approximately 10 Hz (alpha range), both in the raw tracing (left) and the power spectrum (right). The example of panel A2 shows oscillations at approximately 25 Hz (beta range), superimposed on smaller and slower fluctuations; correspondingly, the power spectrum has two main peaks, a large one at approximately 25 Hz and a smaller one at 7 Hz. A1: normal subject, channel Oz (Laplacian derivation); A2: minimally conscious patient subject, bipolar channel Fz-Cz. Note that the power spectrum is calculated from many samples of EEG, totaling 489s for A1 and 348s for A2, but only one typical second of the raw trace is shown.
B. EEG power spectra identify major features of brain dynamics across levels of consciousness. In vegetative state (panel B1), power is concentrated below 1 Hz and the rest of the spectrum is largely featureless. In minimally conscious state (panel B2, but also panels A2 and C1), there is a prominent peak in the 3–7 Hz range, and often a peak in the 15–30 Hz (beta) range. In normal wakefulness (panel B3), there is a peak in the alpha range (8–12 Hz), and variable peaks in the beta range. B1: patient subject, channel Oz (Laplacian derivation); B2: patient subject, channel Fz (Laplacian derivation); B3: normal subject, channel Pz (Laplacian derivation).
C. The coherence identifies the degree of synchronization of activity in pairs of EEG channels. Panel C1: EEG spectra from two locations (POz, upper trace, and P4, lower trace, Laplacian derivations) have similar dynamics (left) and the coherence (right) shows that the dominant theta-range peak is highly synchronous on these channels. Panel C2: EEG spectra from two locations (F8–FC6, upper trace, and F4–FC2, lower trace) also have similar dynamics (left) but the coherence (right) shows that the activity in the 20 Hz range is synchronous, while that in the 12 Hz range is not (arrows). In this patient, the 12 Hz activity corresponds to sleep spindles, which are asynchronous. This asynchrony of sleep spindles is an abnormal finding, likely due to the presence of central thalamic infarctions. C1: Minimally conscious patient subject recorded during wakefulness; C2: Another minimally conscious patient subject recorded during sleep.
All power spectra and coherences performed in Chronux (http://chronux.org/)[11], and error bars (barely visible in Panels A and B) indicate 95% confidence intervals.

