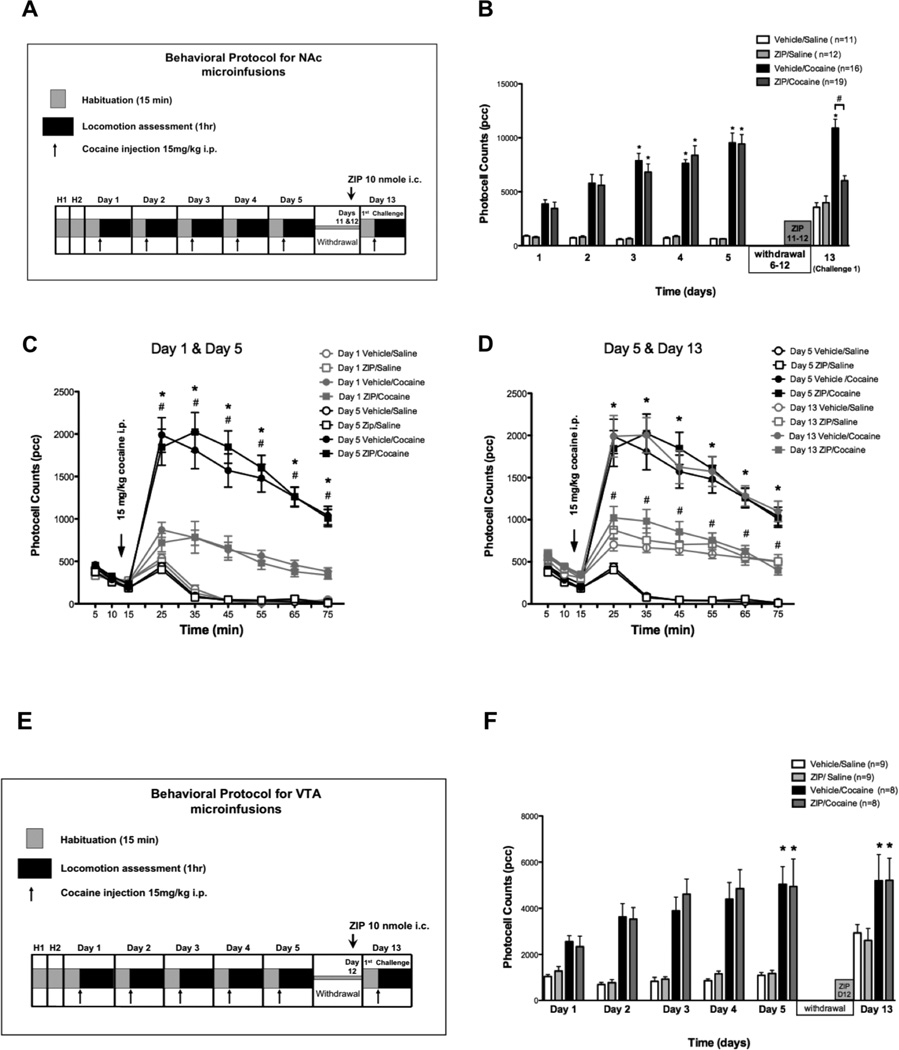
Figure 3. Intra NAc ZIP microinfusions decrease the expression of cocaine sensitization.
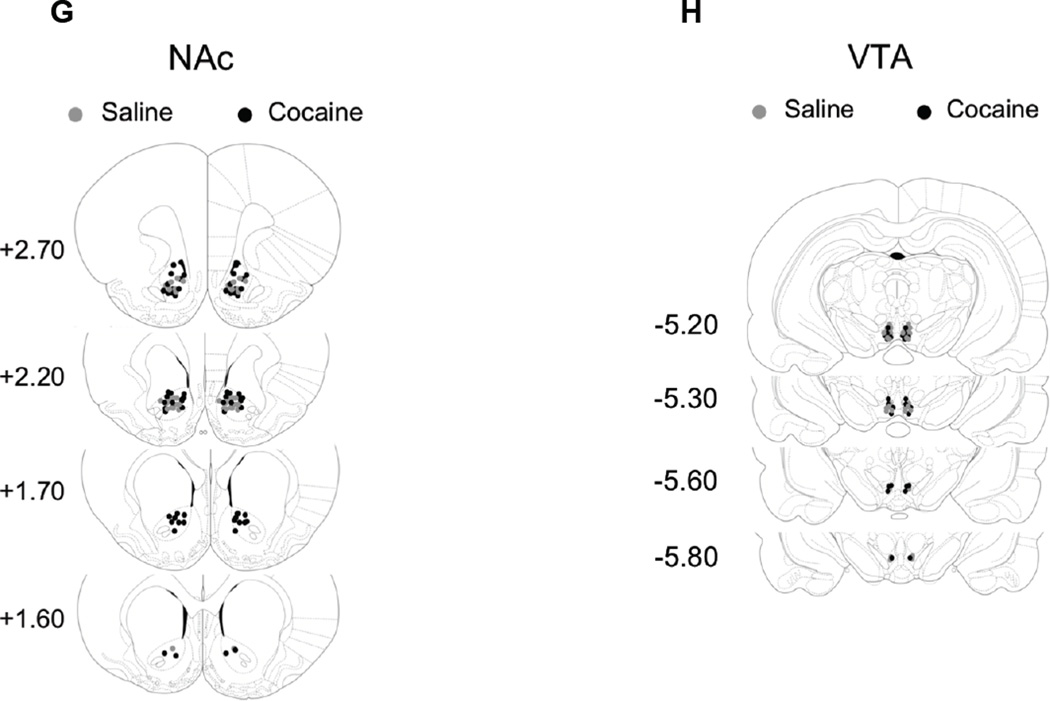
A: Diagram shows cocaine sensitization protocol with time points for intra NAc ZIP microinfusions. B: Mean total ambulatory activity (pcc/60 min, ± S.E.M.) was recorded for each group. Asterisks (*) denote significance of the group compared to corresponding Day 1 (p < 0.01). Numeral (#) denotes statistical significance between groups on Day 6. On Day 5 cocaine treated animals show sensitization to cocaine. On Day 13 ZIP/cocaine treated animals did not express sensitization (p > 0.05). Instead, they showed a significant decrease (Day 13) in locomotor activity when compared to Vehicle/cocaine animals (p < 0.05). There was no significance between ZIP/saline and vehicle/saline controls throughout the experiment (p > 0.05). C: Time course of locomotor responses after one (grey) and five (black) days of cocaine (15 mg/kg, i.p.) (filled) or saline (unfilled) administration. Cocaine sensitization was manifested as an increase in locomotor activity in all time points. Significant differences between day 1 and day 5 (p < 0.05) are indicated by asterisk (*) for vehicle/cocaine and # for ZIP/cocaine. Each time point represents the mean ± SEM. D: Time course for the locomotor response on Days 5 (black) and 13 (grey). ZIP/cocaine injected animals (filled grey squares) show decreased locomotor activity (* p < 0.05) compared to Day 5 (#). Asterisks (*) denote significance between ZIP/cocaine and vehicle/cocaine animals on day 13. Each point represents the mean ± SEM. (Two-way ANOVA, followed by bonferroni post-test for all comparisons). E: Injection sites within the NAc for saline (grey circles) and cocaine (black circles) treated animals.


