
Figure 2.
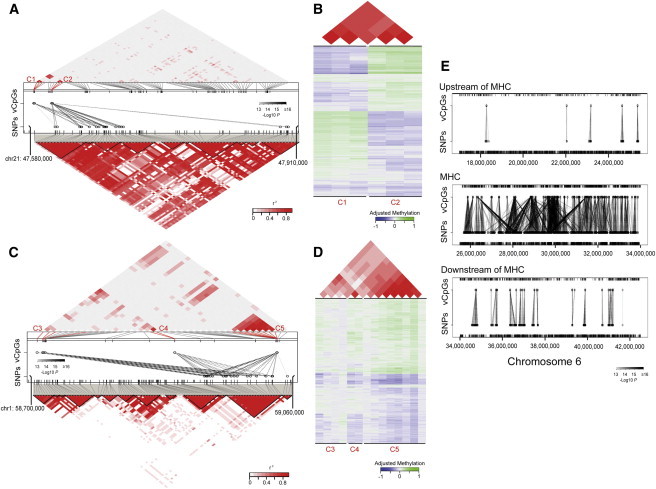
GeMes: Genetically Controlled Methylation Clusters
(A and C) Examples of GeMes on chromosomes 21 (A) and 1 (C). In the middle panels, each dashed line represents a significant association between a CpG and a SNP. The shades of black for these lines indicate significance of the associations. The ticks represent CpGs (top) and SNPs (bottom) that were covered in the arrays. Identified CpG probes whose methylation levels are controlled by genotype are indicated and highlighted in red. The methylation correlation (top panels) and genetic-LD correlation (bottom panels) for all the probes covered in the region are shown correspondingly. The measure of the correlation coefficient of the methylation level, as well as the genetic-LD correlation, is shown graphically according to the shades of red; gray represents low r2, and red represents high r2.
(B and D) Plots of detailed DNA-methylation levels, as well as their correlations, are shown; (B) is collapsed from (A) and (D) is collapsed from (C) to include only sites on GeMes. Bottom panels: each row represents the methylation residual of one individual, and each column represents a different CpG site whose location is indicated and highlighted in (A) or (C). Values of DNA-methylation residuals range from low (blue) to high (green) on the color scale. Top panels: the measure of the correlation coefficient of the methylation level for the corresponding CpG sites.
(E) Associations between CpG sites and SNPs upstream of (top panel), within (middle panel), or downstream of (bottom panel) the major histocompatibility complex (MHC) region. Each dashed line represents a significant association, and the shades of black indicate significance of the associations.